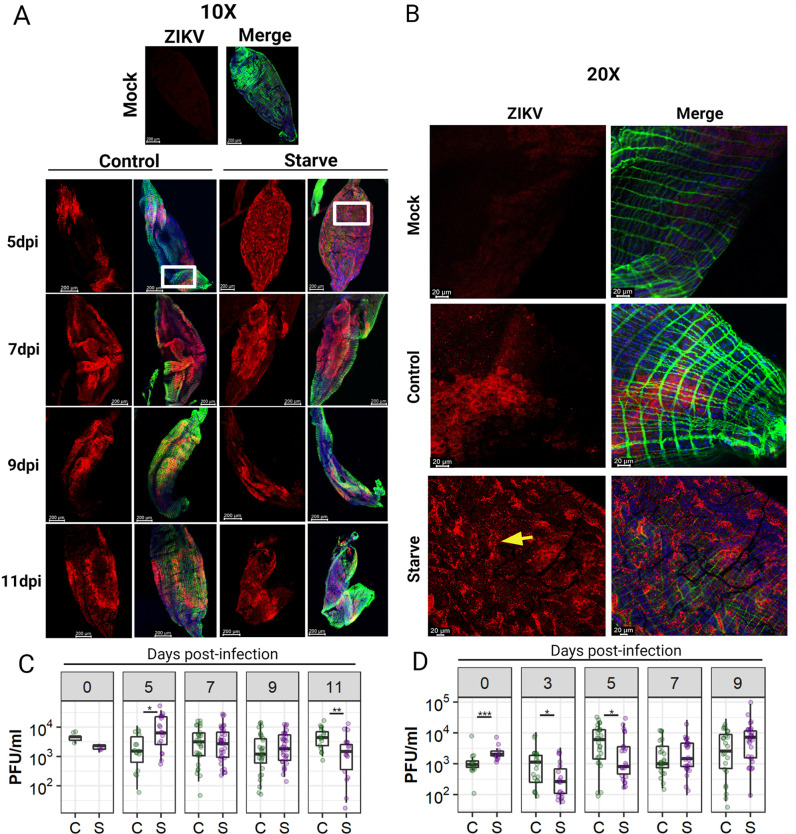
Fig 3. Intensity of ZIKV I-44 midgut infection in Control and Starve Ae. aegypti HWE following oral ingestion of virus.
(A, B) Midguts were dissected at 5, 7, 8, 9, and 11 days post-infection (dpi) via a ZIKV containing blood-meal. ZIKV titre in the blood-meal for all challenges was 1x10⁶ PFU/mL. Fixed midguts were incubated with the flavivirus-specific 4G2 primary mouse monoclonal antibody and secondary anti-mouse Alexa Fluor (AF) 594 labeled monoclonal antibody (red). Actin filaments were stained using Alexa Fluor (AF) Phalloidin 488 (green); nuclei were stained using DAPI (blue). Mock samples show non-infected midguts which underwent the same staining procedure as the infected midguts. (A) Midguts were imaged at 10x magnification to show overall midgut infection pattern using an inverted spectral confocal microscope (TCP SP8 MP, Leica Microsystems). (B) 20x magnified images showing detailed infection foci of 5 dpi midguts (area within white square at 10x magnification). Yellow arrow indicates specific punctate infection foci in Starve midgut compared to zonal infection in the Control midgut. At least 6 midguts were visualized per group/timepoint in two independent experiments. (C, D) Midguts were dissected over a time-course following oral challenge of mosquitoes with ZIKV-containing blood-meals and virus quantified by plaque assay. (C) Experiment 1: ZIKV titre in midguts at 0 (immediately after blood-meal ingestion), 5, 7, 9, and 11 dpi. (D) Experiment 2: ZIKV titre in midguts at 0, 3, 5, 7, and 9 dpi. Boxplots show median, upper, and lower quartiles and data extremities. Dots represent individual midguts. n = 20–39 midguts per timepoint. Statistics were based on Mann-Whitney U-test; * = p < 0.05, ** = p < 0.01, *** = p < 0.001. C = Control, S = Starve.

