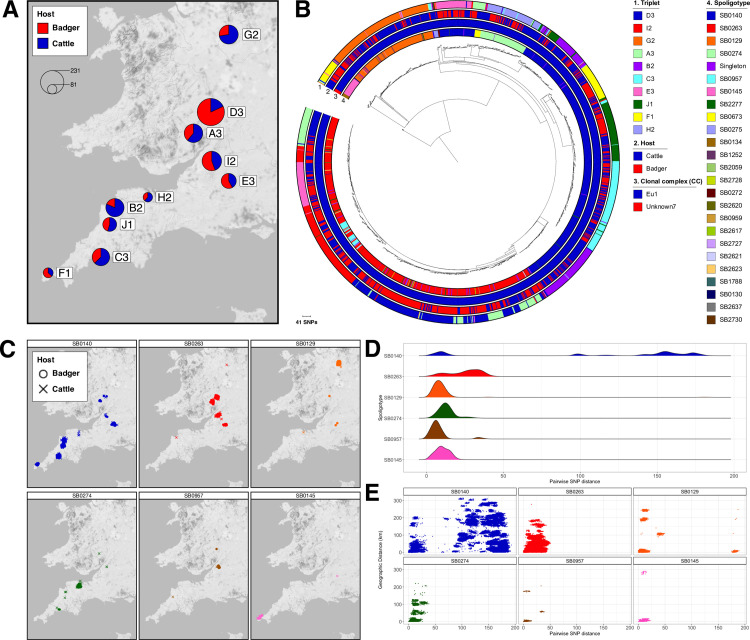
Fig 1. Genomic epidemiology of Randomised Badger Culling Trial (RBCT) dataset.
A) Map showing location of isolation for 1,442 sequenced Mycobacterium bovis isolates. Isolates collected from badgers and cattle are shown in red and blue respectively. The proportion of samples from each host is shown in the pie charts and the pie charts are scaled according to the number of isolates. The RBCT triplet where each of the isolates were collected is labelled; B) Maximum likelihood phylogenetic tree of 1,442 M. bovis isolates rooted with isolates from the Unknown7 clonal complex. Trial area, host, clonal complex and spoligotype are shown as datastrips around the outside of the phylogenetic tree; C) Geographical distributions of the six most prevalent spoligotypes in the dataset. The host of each isolate is represented by a different shape: circle for badger and cross for cattle; D) Frequency distributions of pairwise SNP distances between all isolates belonging to the six most prevalent spoligotypes; E) Scatterplots of pairwise SNP distance against geographic distance in kilometres for all pairs of isolates belonging to the six most prevalent spoligotypes.

