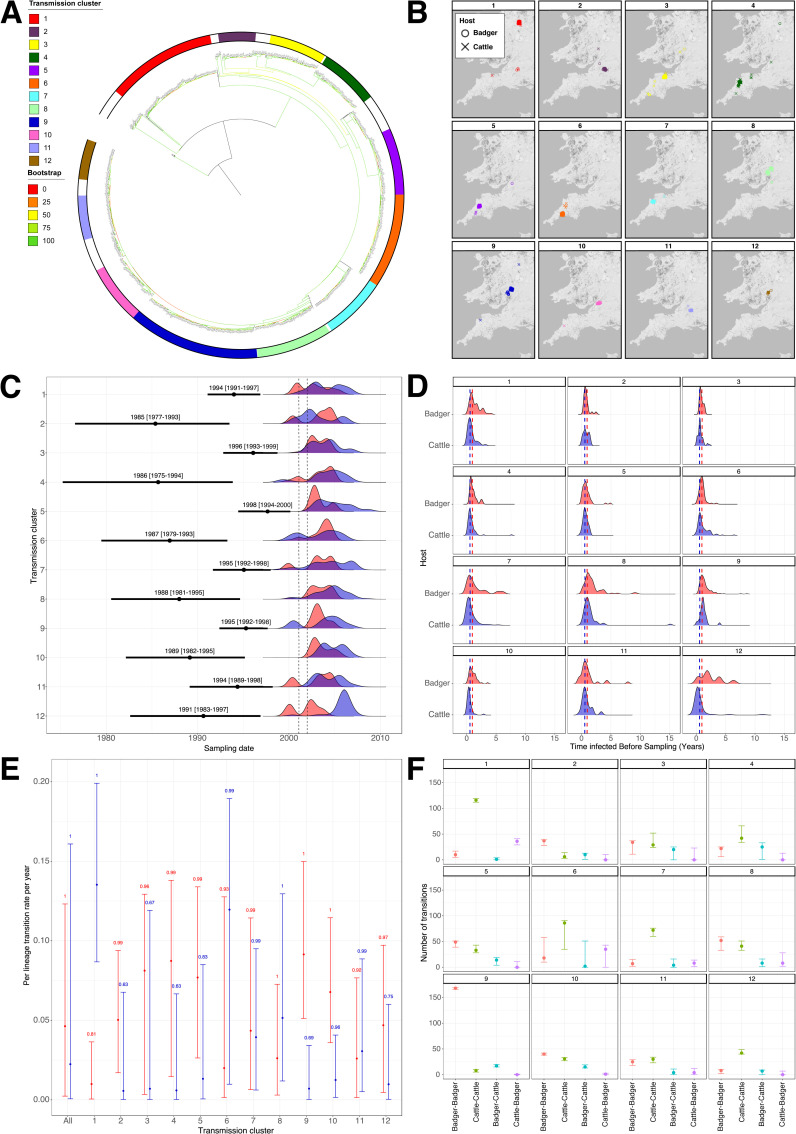
Fig 3. Transmission in the Randomised Badger Culling Trial (RBCT) dataset.
A) Maximum likelihood phylogenetic tree of 1,442 isolates with the twelve putative transmission clusters annotated; B) Geographical distributions of the twelve putative transmission clusters. The host of each isolate is represented by a different shape: circle for badger and cross for cattle; C) Molecular dating of transmission clusters. The inferred median and 95% HPD of the MRCA for each transmission cluster is shown in black. The dates of collection of samples within each transmission cluster are shown as frequency distributions and coloured according to host (red for badgers and blue for cattle). The time period of the suspension of badger culling due to FMD is represented by dashed lines; D) Median length of time of infection for all isolates before sampling per transmission cluster. The medians of all isolates are shown by red and blue dashed lines for cattle and badgers respectively; E) Estimated inter-species transmission rates for each transmission cluster. The vertical lines show the lower and upper (2.5% and 97.5%) bounds of the transmission rate distribution for each transmission cluster. The values above the vertical lines represent the posterior probability of each rate and the distributions are coloured according to direction of transmission (red for badger-to-cattle and blue for cattle-to-badger transmission); F) Number of transmissions between known and estimated species counted on each phylogenetic tree in the posterior distribution for each transmission cluster. The vertical lines show the lower and upper (2.5% and 97.5%) bounds of the distributions. The distributions are coloured according to the type of transmission (red for badger-badger, green for cattle-cattle, blue for badger-cattle and purple for cattle-badger).

