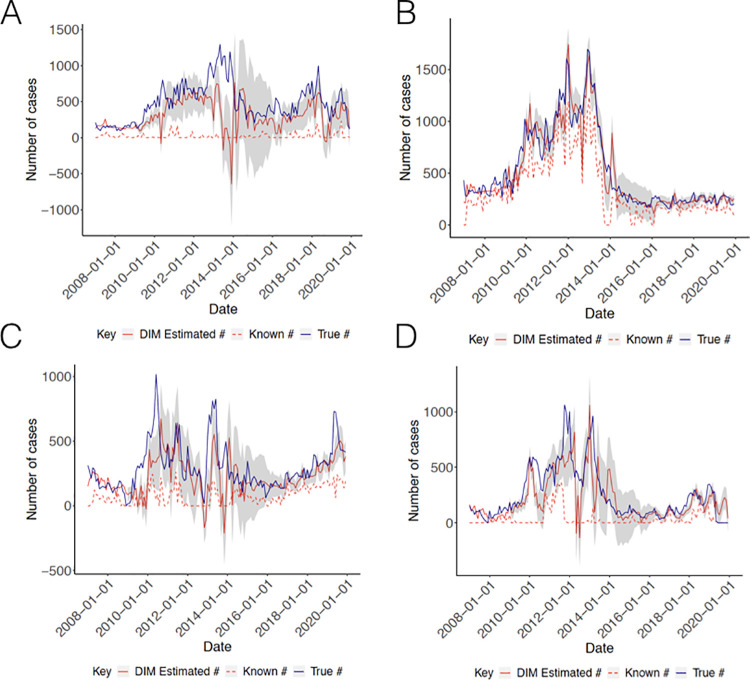
Fig 3. Results from Data Imputation Models.
(A) Regions 1 (B) Region 4 (C) Region 7 and (D) Region 8. Solid red lines indicate the number of cases estimated from the data imputation model, dashed red lines indicate the number of cases known by the end of the month and solid blue lines indicate the true number of eventually reported cases. Grey bands capture the moving 95% confidence intervals for each model.

