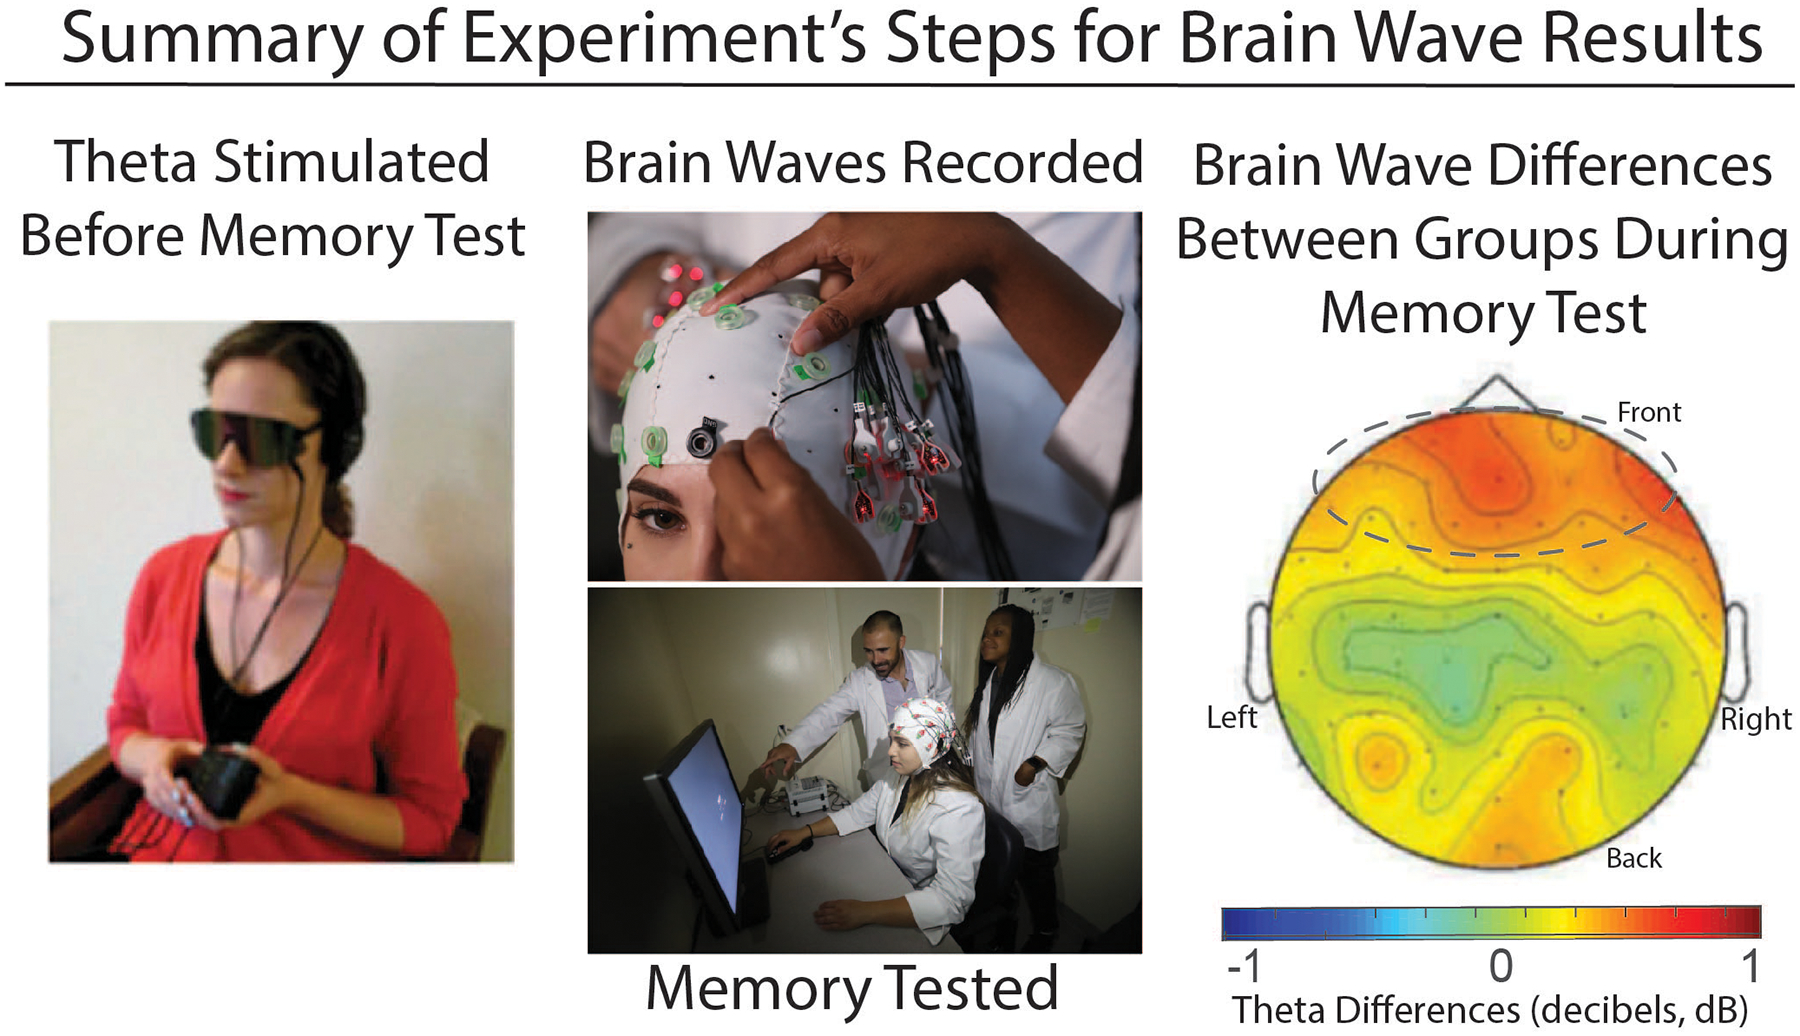
Figure 3.

(A) After learning the words, participants received audio-visual entrainment of their brain waves using either theta (4–6 Hz) or beta (14 Hz) stimuli. (B) During the memory test, participants had their brainwaves recorded with EEG. (C) The group that received theta stimulation showed higher theta activity during the memory test than the beta group did. This brain map (as if we were looking down on the brain from above) theta differences during memory: subtracting between groups that received either theta or beta stimulation beforehand. The color scale shows theta activity during the memory test. The main differences were seen in the frontal sites, which are circled.
