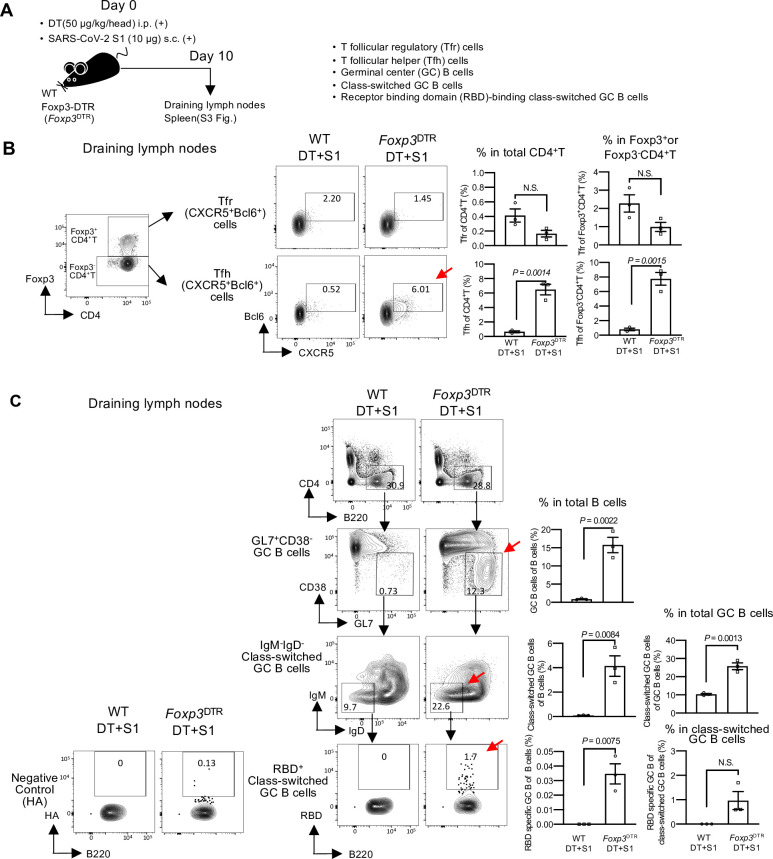
Fig 2. Transient Treg-cell depletion induces the formation of follicular helper T cells and antigen-specific B cells in S1-injected mice.
(A) A schematic diagram showing the experimental workflow. As in Fig 1A, but follicular helper T(Tfh), follicular regulatory T (Tfr) and B cells from draining (axillary and popliteal) lymph nodes and spleens were analyzed on day 10 post-injection. (B) Representative gating strategy used to identify Tfr and Tfh cells (S1B Fig, gating strategy). Representative FACS plots of two independent experiments are shown. Representative graphs of two independent experiments are shown as the mean ± SEM (n = 3/group). Data were analyzed using unpaired Student’s t-test. (C) Representative FACS plots of GL7+CD38- germinal center (GC) B cells gated on live B220+ CD4- cells (S1C Fig, gating strategy). IgM- IgD- class-switched GC B cells were gated on GL7+ CD38- GC B cells. RBD-binding class-switched GC B cells were gated on IgM- IgD- class-switched GC B cells. Influenza virus HA protein was used as the negative control for RBD-binding. Representative FACS plots of two independent experiments are shown. Representative frequencies of GC B, class-switched GC B, and RBD-binding GC B cells from two independent experiments are plotted as the mean ± SEM (n = 3/group). Data were analyzed using unpaired Student’s t-test.

