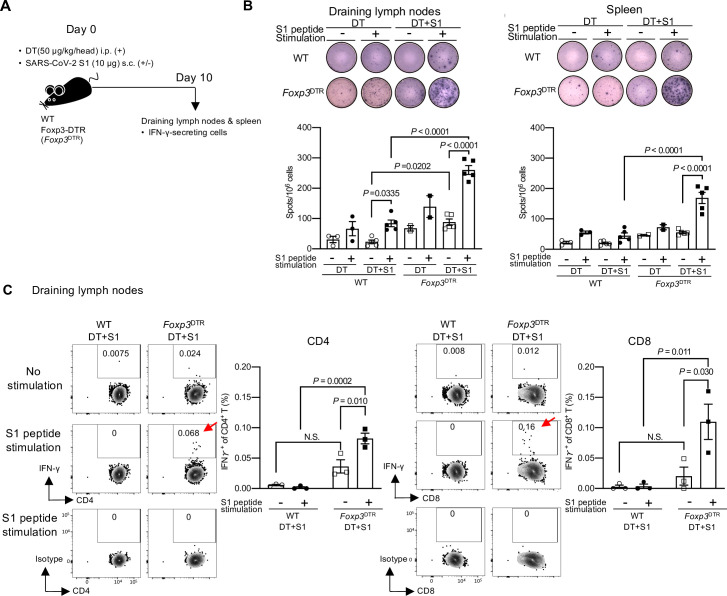
Fig 5. SARS-CoV-2 antigen-specific IFN-γ producing CD4+ and CD8+ T cells are successfully induced in transient Treg cell-depleted mice.
(A) A schematic diagram showing the experimental workflow. As in Fig 1A, but IFN-γ-secreting cells in draining lymph nodes (axillary and popliteal) and spleen on day 10 were analyzed using ELISpot and intracellular cytokine staining. (B) Representative pictures of IFN-γ ELISpot assays from draining lymph nodes and spleens on day 10 following S1 and DT injection are shown (top). The plates of the ELISpot Kit are from R&D Systems Inc.. IFN-γ-secreting spots were quantified after 36 h of stimulation with 1 μg/mL S1 peptide pool. The graphic data are a summary of two independent experiments. The data are represented as the mean ± SEM (DT-injected WT mice, n = 3; DT-injected Foxp3DTR mice, n = 2; DT+S1-injected WT mice, n = 5; DT+S1-injected Foxp3DTR mice, n = 5). Data were analyzed using two-way ANOVA with Tukey’s multiple comparisons test. (C) IFN-γ-secreting cells from draining lymph nodes on day 10 were analyzed by flow cytometry after 6 h of stimulation with 1 μg/mL S1 peptide pool. Representative FACS plots from two independent experiments are shown for CD4+ (left) and CD8+ T (right) cells, gated on live CD45+, CD3+ cells (S1E Fig, gating strategy). The graphic data of the frequencies of IFN-γ positive cells are representative from two independent experiments (n = 3/group). The mean ± SEM is shown. Data were analyzed using two-way ANOVA with Tukey’s multiple comparisons test.

