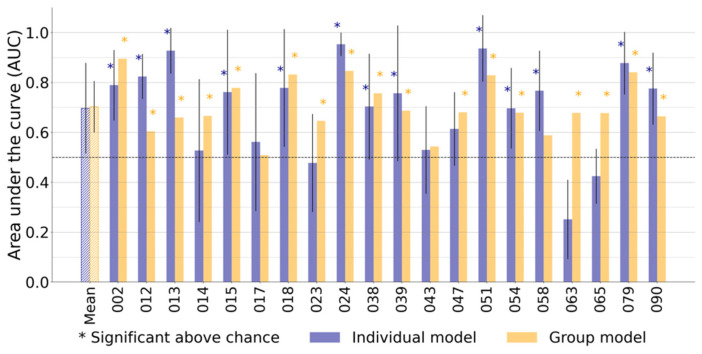
Figure 3.
Classification of medication induced motor fluctuations on short accelerometer time windows in individual participants. The first pair of bars represents the mean area under the curve (AUC) score over the twenty participants. Each subsequent pair of bars (002 to 090) represents the AUC scores from one participant. The blue bars represent the AUC score for the individual model, and the yellow bars represent the group model. Note that for the individual models, AUC scores are the averages over the multiple cross-validation folds within a participant (Figure 1B). The asterisks indicate whether the corresponding AUC score was significantly better than chance level (5000-repetitions permutation test). Both models have equal mean AUC scores. It is notable that the majority (18 out of 20 of participants) has at least one significant score. Half of the participants yielded a higher AUC score with the individual model than with the group model.

