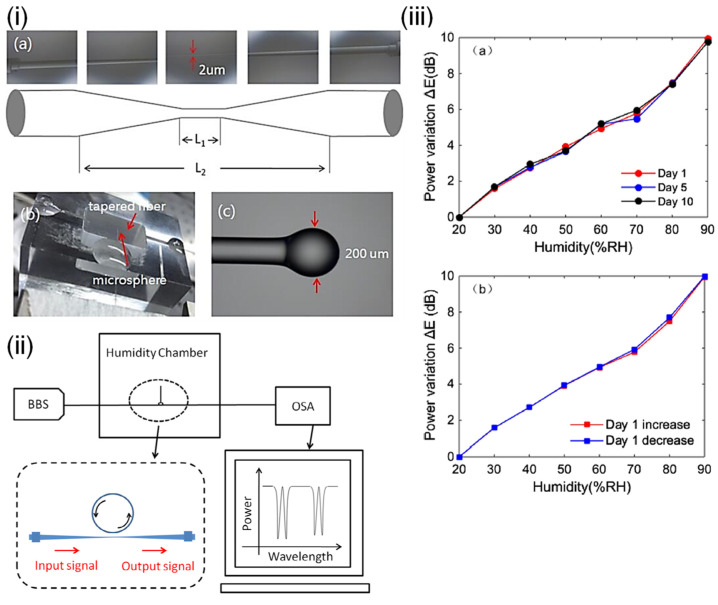
Figure 28.
Point sensor. (i) (a) Schematic of tapered fiber. (b) Photograph of the packaged sensor. (c) Microscope image of the microsphere. (ii) Experimental setup. (iii) (a) RH vs. power variation over time. (b) Hysteresis graph. Adapted with permission from ref. [139]. Copyright 2018 Elsevier.

