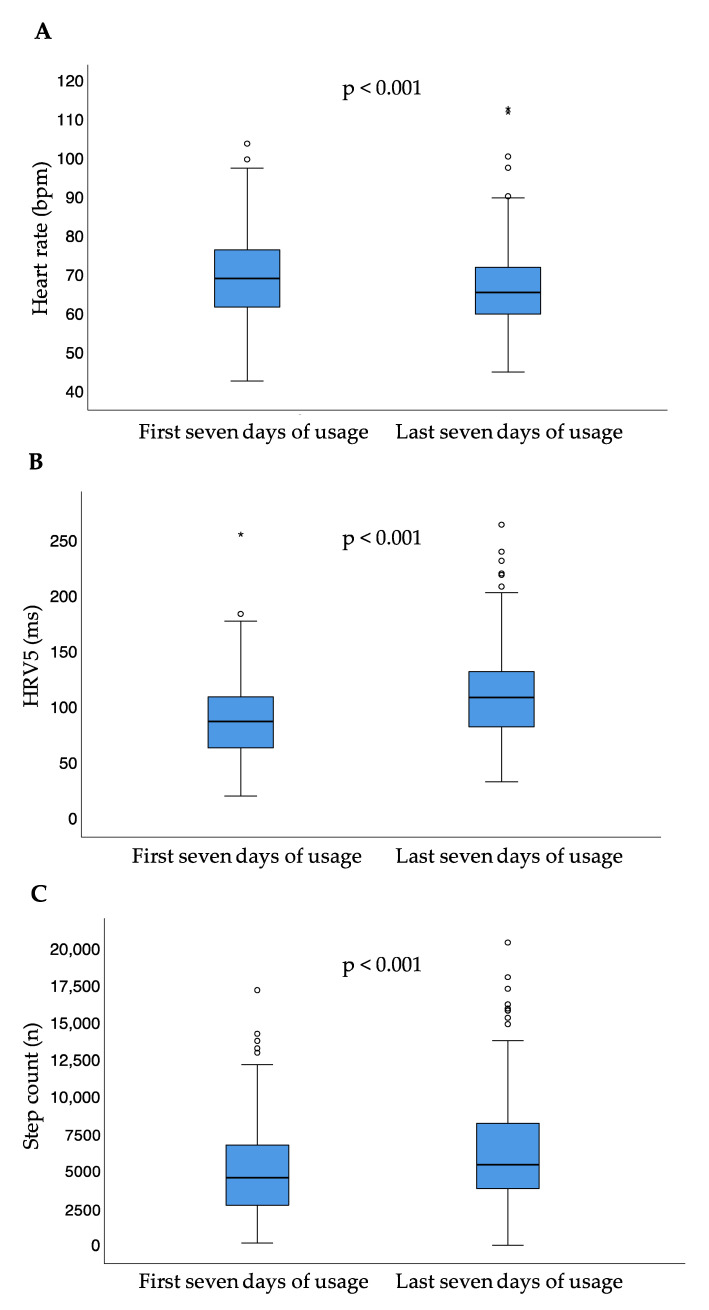
Figure 4.
Heart rate (A), heart rate variability approximate (B), and step count (C) for the first and last seven days of usage; small circles represent outliers (data points outside the range of 3rd quartile + 1.5* interquartile range or 1st quartile − 1.5* interquartile range); asterisk represent extreme outliers (data points outside the range of 3rd quartile + 3* interquartile range or 1st quartile − 3* interquartile range); bpm = beats per minute; HRV5 = heart rate variability approximate.

