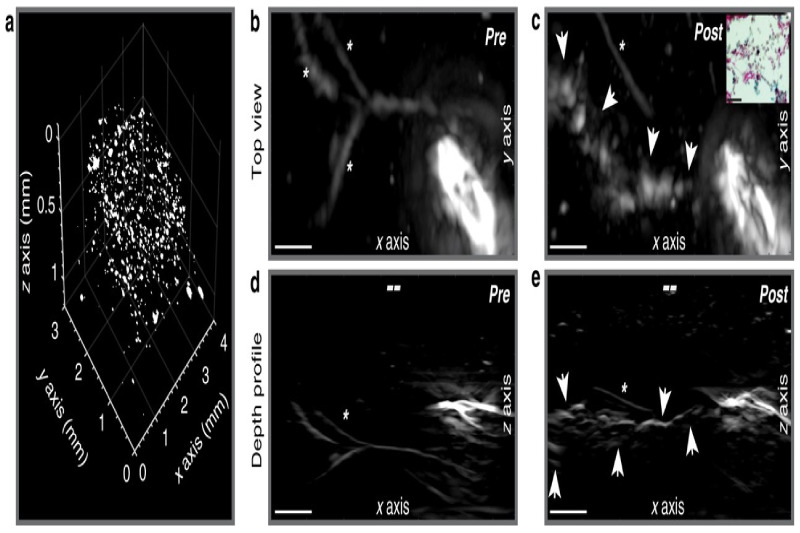
Figure 8.
HDP facilitates single-cell visualization with raster-scan optoacoustic mesoscopy (RSOM). Signals of HDP-laden primary macrophages are separated from hemoglobin in blood-agar phantoms and depicted in a volumetric scatter plot. Subcutaneous injection in the dorsal area of a FoxN1 nude mouse of the cells measured in (a). A catheter was used to determine the injection area and scans were recorded pre- (b,d) and post (c,e) cell injection showing the top view and a depth profile. The opening of the needle is seen on the right side of the images from which the macrophages emerge post injection as a dense line-up (arrows), 0.7–1 mm below the skin surface (–). Blood vessels are faintly detected at 630 nm and indicated by *. Scale bars are 500 µm in x, y, and z. Inset in panel (c) shows labeled macrophages in histological tissue sections with Schmorl’s staining. The outtake corresponds to an area near the needle tip. Scale bar is 50 µm. Reprinted from [129] with permission.

