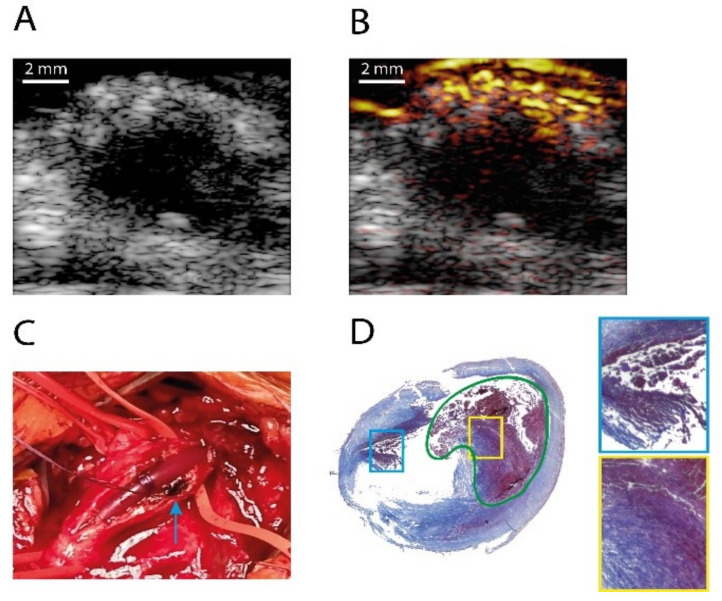
Figure 9.
In vivo PA and US image of a human carotid artery with intraplaque hemorrhage; (A) US image; (B) overlaid PA/US image (808 nm, dynamic range 23 dB); (C) photo of the carotid plaque during the CEA surgery; (D) Masson’s trichrome staining of the artery. The area indicated in green is a lipid core filled with a large hemorrhage. The highlighted boxes show two regions of hemorrhages found in the plaque. Reprinted from [132] with permission.

