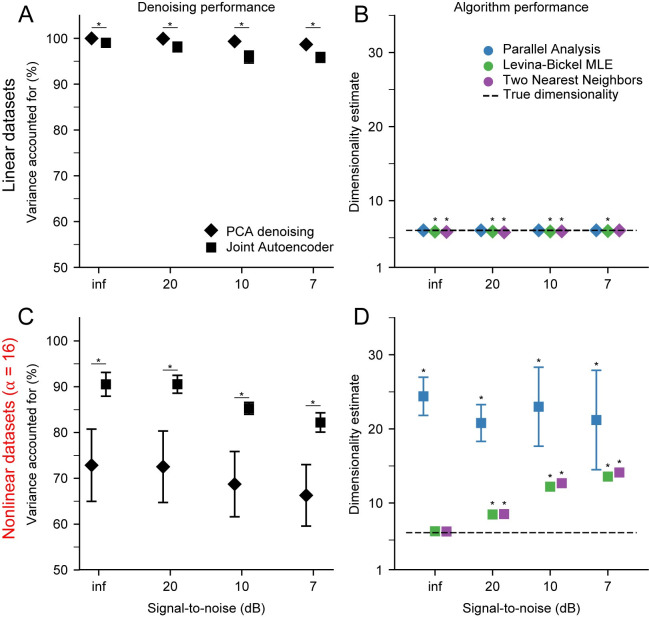
Fig 9. Performance of PCA and Joint Autoencoder (JAE) denoising algorithms.
A) PCA and JAE denoising applied to linear datasets (n = 10) with varying signal-to-noise ratio. Symbols indicate the mean and error bars indicate the standard deviation of the VAF between noise-free and denoised signals. Asterisks indicate significant difference between mean values at the significance level of α = 0.05. B) Dimensionality estimation on linear datasets after PCA denoising. Dimensionality was estimated using Parallel Analysis (PA), Levina-Bickel Maximum Likelihood Estimation (LBMLE), and Two Nearest Neighbors (TNN). Symbols indicate the mean and error bars indicate the standard deviation of the dimensionality estimates. Asterisks indicate significant differences of the mean from the true dimensionality of 6 at the significance level of α = 0.05. C) Same as in A, but for nonlinear datasets. D) Same as in B, but for nonlinear datasets after JAE denoising.

