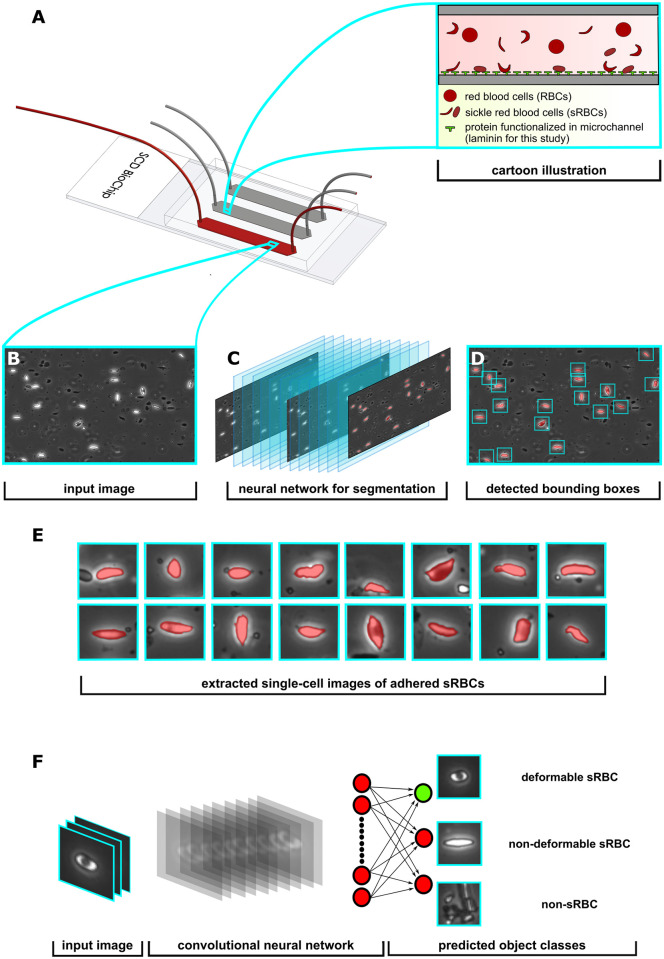
Fig 2. Overview of processing pipeline.
A: SCD BioChip and cartoon illustration represents an in-vitro adhesion assay and adhesive dynamics of sRBCs within a mimicked microvasculature. B: Generated input image fed into the Phase I network. C: Phase I segmentation network predicts pixels belonging to adhered sRBCs, shaded red in the images. D: Drawing bounding boxes around segmented objects. E: Extracting adhered objects into individual images. F: The input layer of the Phase II classifier network receives an image from the Phase I detection network, then performs a series of convolutions and nonlinear activations to finally output class predictions.

