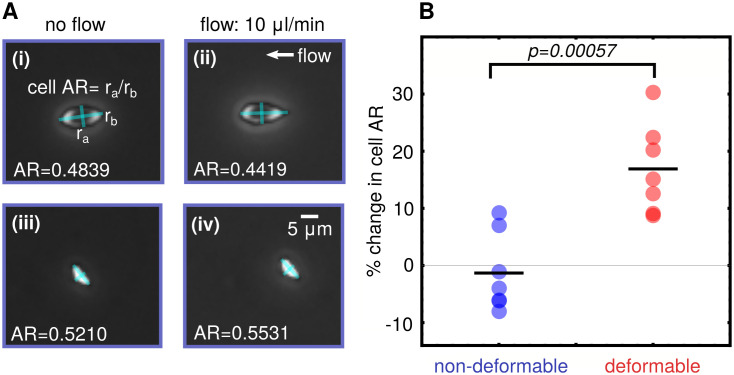
Fig 4. Cell deformability analysis.
A: Schematic for estimation of change in cell aspect ratio (AR) between flow and no flow conditions. (i-ii) show a deformable type cell, and (iii-iv) a nondeformable. B: Mapping deformability to morphology: Cells visually identified as the deformable morphological subtype show significantly higher percentage change in cell AR between flow and no flow conditions compared to the non-deformable subtype.

