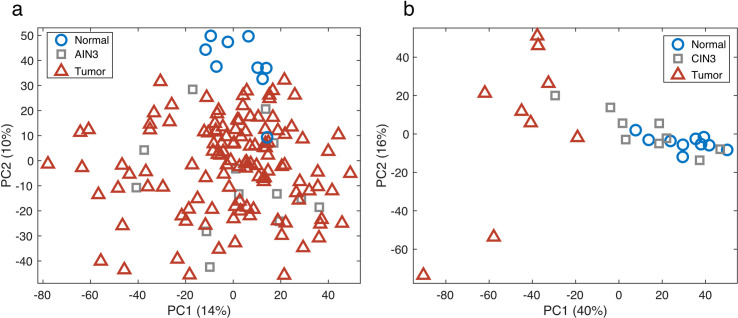
Fig 1. Principal Components Analysis (PCA) score plot.
The PCA model, using >300, 000 beta-values, separates normal tissues (blue circles) from tumor samples (red triangles) for both AC (a) and CC (b). AIN3 samples (a, grey squares) clustered more with the tumor samples, whereas CIN3 samples (b, grey squares) segregated into those similar to normal epithelium and others more similar to cancer.

