Fig 2.
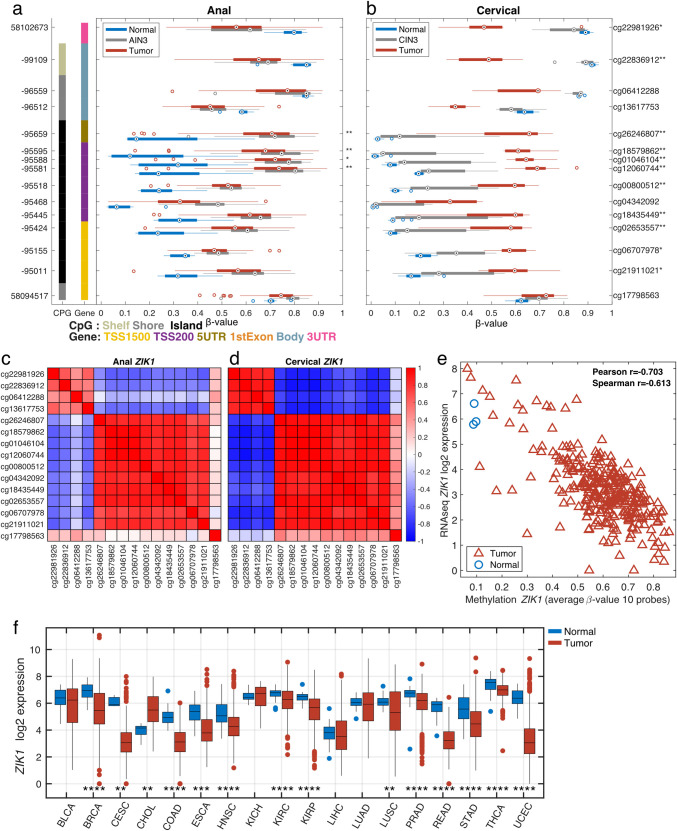
Gene structure methylation plot of differentially methylated CpG loci within ZIK1 in anal (a) and cervical (b) tissues. Genomic coordinates are represented on the left vertical axis and methylation probe IDs (or CpG loci) on the right vertical axis. For each of the 15 CpG loci, boxplots illustrate the median (dot) and interquartile ranges [25th (low boundary of box) and 75th (upper boundary of box) percentiles] of β-values in tumor (red boxes), AIN3 or CIN3 (grey boxes) and normal (blue boxes). Significantly different median methylation at each CpG loci is noted as * for p<0.05 and ** for p<0.005. Among the 15 CpG sites presented, 4 CpG sites fall within the overlapping DMRs that were significantly hypermethylated in both anal (a) and cervical (b) cancers. For ZIK1, the anal in situ (AIN3) samples showed similar methylation levels to those of tumor samples whereas for CIN3, methylation levels were similar to normal cervical tissues. Corresponding correlation plots between all ZIK1 probes for anal (c) and cervical (d) cancers show a high degree of correlation for ten of the probes. The average methylation levels for the ten correlated probes show high correlation (r = -0.7) to RNAseq gene expression levels in the TCGA CESC dataset (e). The tumor vs. normal expression levels across multiple TCGA tumor types are shown (f, *p<0.05, **p<0.01, ***p<0.001 & ****p<0.0001).

