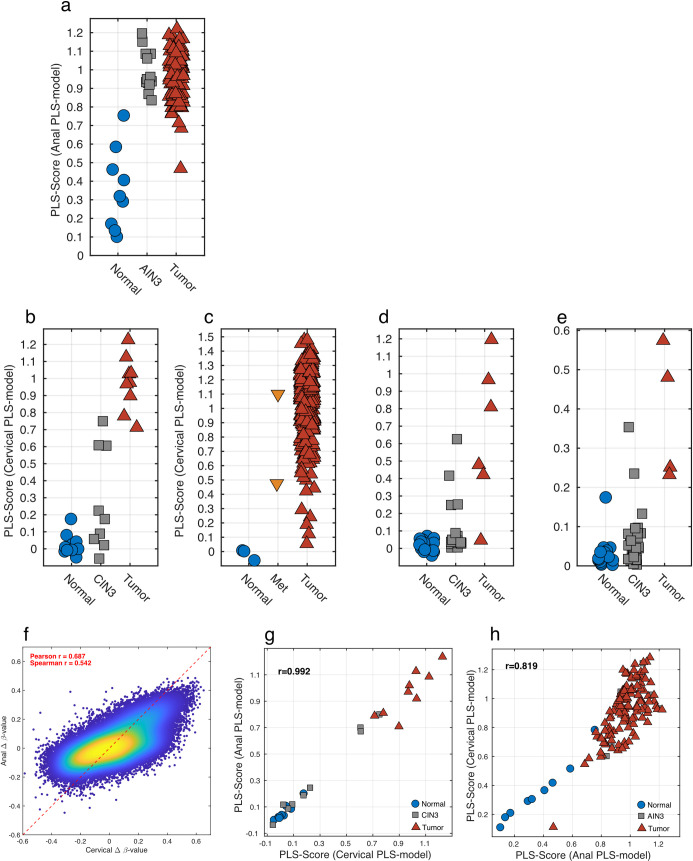
Fig 4.
Methylation models for Anal (a-b) and Cervical (c-f) Cancer progression and similarities between Anal and Cervical methylation (g-h). The AC progression PLS model applied to the Anal dataset showed a clear distinction of normal and tumor samples, with the AIN3 samples scoring as tumor like (a). The CC progression PLS model applied to the Cervical dataset differentiates normal and the tumor samples with 3 of the CIN3 samples scoring as tumor-like and 6 as normal-like (b). The CC progression PLS model was further validated on three additional datasets. The TCGA Cervical dataset where the normal (n = 3) samples scored low, the metastatic (Met, n = 2) samples scores as tumors and all but 5 tumor (n = 307) samples scored high (c). In the GSE46306 cervical dataset, all of the normal (n = 20) samples scored as “normal” and most of the tumor (n = 6) scored as tumors while most of the CIN3 (n = 18) scored as “normal-like” with several being classified as “tumor-like” (d). Finally, in GSE99511 all normal cases (n = 28) scored appropriately while tumors (n = 4) scored higher with the majority but not all CIN3 cases (n = 36) scoring as “normal-like” (e). Density scatter plot for Δ β-values for tumor versus normal for cervical tissues on the x-axis and anal tissues on the y-axis (f). The high correlation indicates that the Δ β-values are similar when comparing the progression of both cervical and anal cancers. This was further explored by applying the AC progression PLS model to the cervical dataset and comparing it with the CC progression PLS model (g). The high correlation implies that the methylation changes are similar in cervical between anal cancers. This was further corroborated, when the CC progression PLS model was applied to the anal dataset and a similar high correlation was observed (h).

