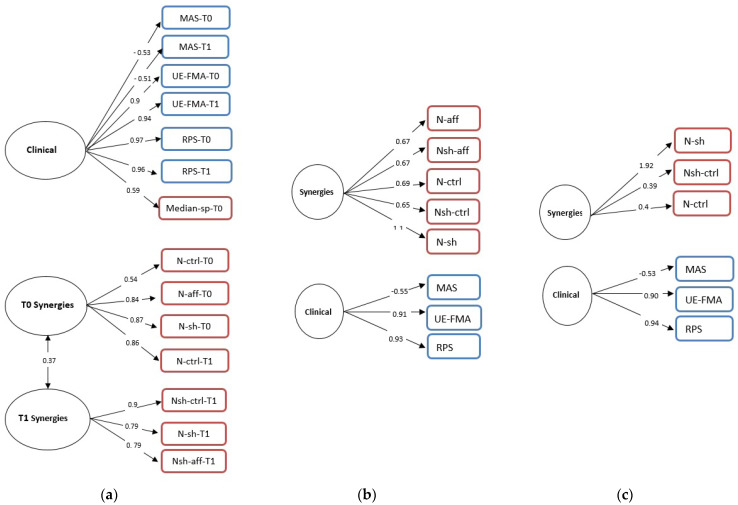
Figure 2.
Confirmatory factor analysis for all variables (a) at T0 (b) and at T1 (c). Single-headed arrows indicate direct relationships. The numbers on each represent standardized factor loadings ranging from 1.0 to −1.0. Squares represent measured variables and circles represent latent factors. The figures in blue represent the clinical variables, while those in red represent the synergies parameters. The double-headed arrows represent correlations between the factors.

