Figure 3.

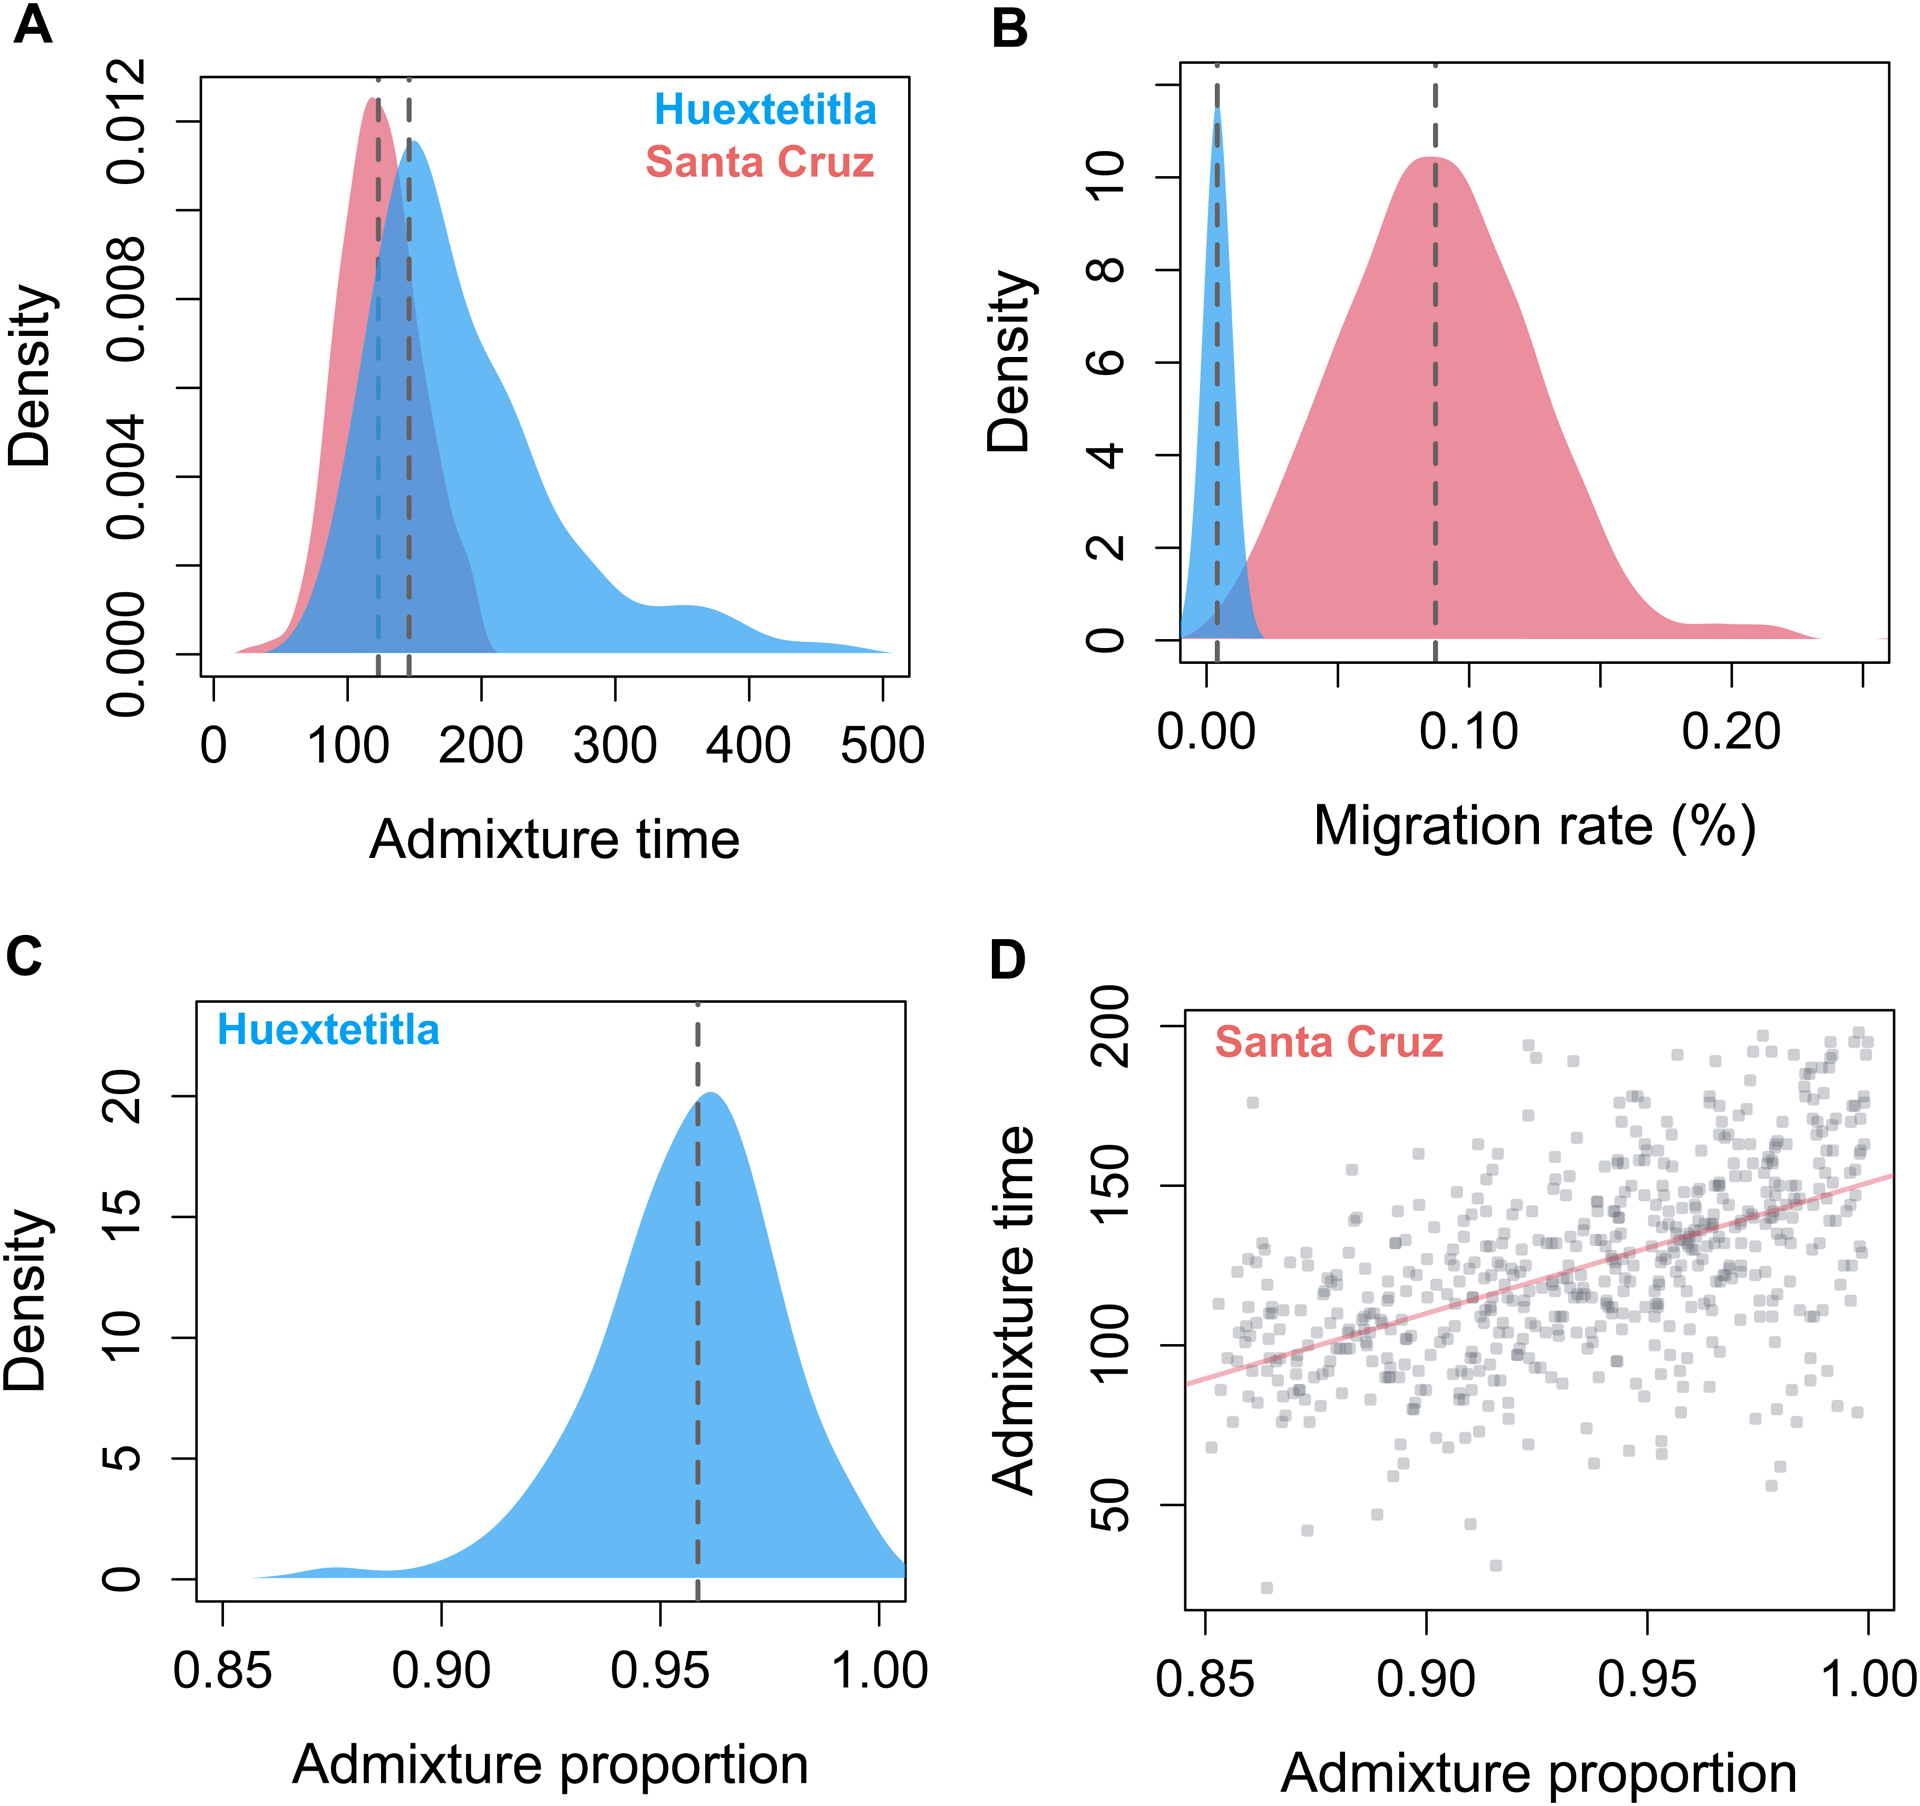
Posterior distributions from Approximate Bayesian Computation simulations inferring demographic history of the X. cortezi ancestry cluster in Huextetitla (blue) and Santa Cruz (pink). A) Posterior distributions for admixture time indicate that both populations formed relatively recently, in the last ~150 generations. B) Posterior distributions of per-generation migration rate reflect substantial differences between populations which can also be observed in variation in admixture proportions (Fig. 2A). C) For the Huextetitla population, where cross-cluster migration rates are much lower, we recovered a well-resolved posterior distribution of initial admixture proportion. D) For the Santa Cruz population, accepted initial admixture proportions span a wide range of parameters and co-vary with both the time since initial admixture (shown here) as well as the cross-cluster migration rate (Fig. S9). For C and D, an admixture proportion of 1 indicates pure X. cortezi ancestry genome-wide.
