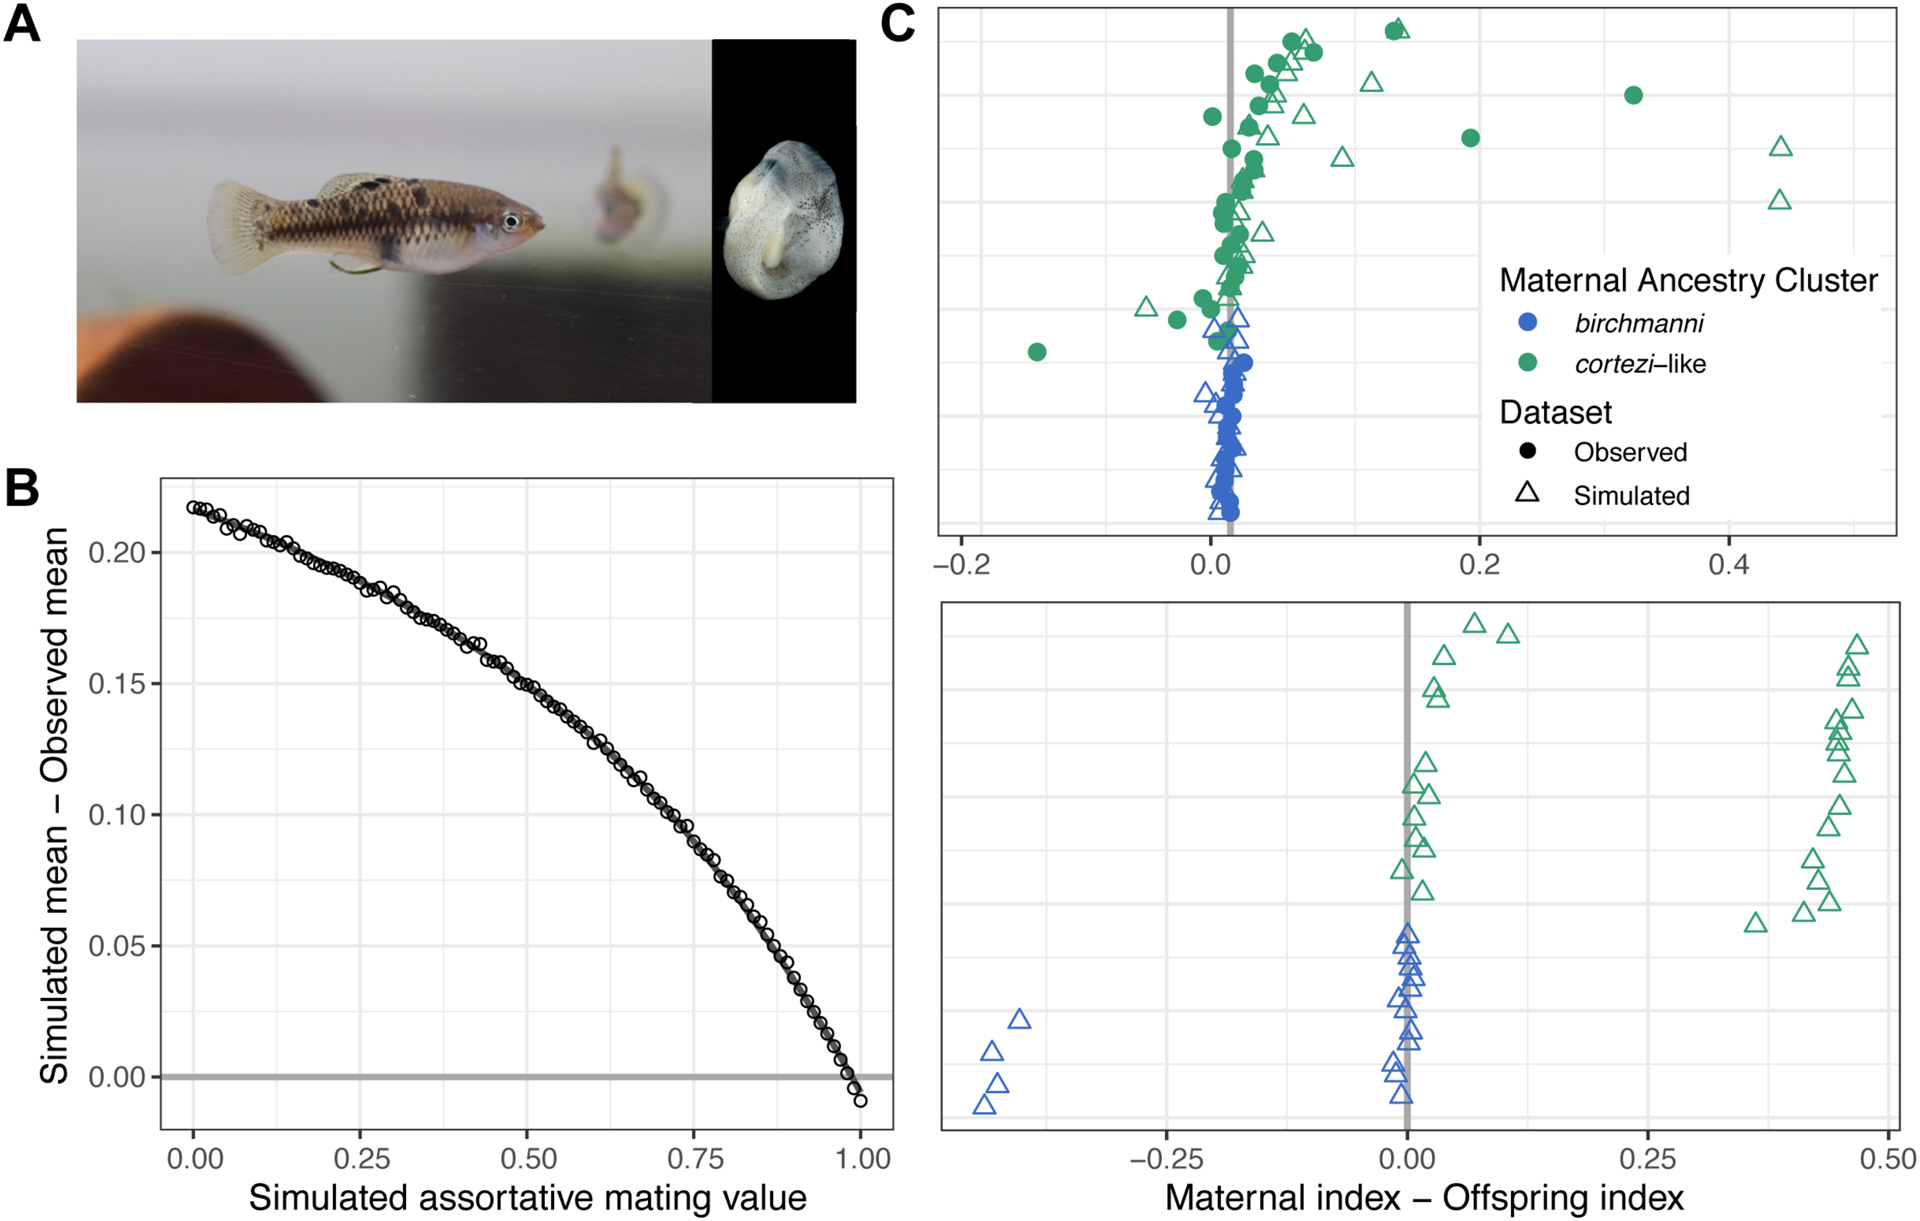
Figure 4.

Results of assortative mating simulations in the Santa Cruz population. A) Photos of a pregnant X. cortezi-cluster female and a representative embryo. B) Results of simulations ranging from 0–100% assortative mating in increments of 1% comparing the simulated versus observed difference in maternal and offspring ancestry index. Simulations of 98% assortative mating minimized the difference between the observed and simulated datasets. C) Top – In the observed data (circles; see Fig. S13) and simulated data of 98% assortative mating (triangles), few offspring have dramatically different ancestry from their mothers. Bottom – In contrast, many such individuals are observed in simulations of random mating. Points close to the zero line represent females that mated with males from their own ancestry cluster. Individuals are colored based on their maternal ancestry cluster and are placed on the y-axis based on increasing X. cortezi ancestry.
