
Table 4.
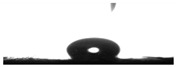
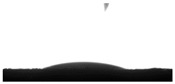
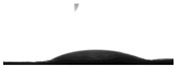
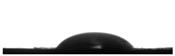
Contact angle data, surface energy, porosity, and water uptake of the CA13 membranes before and after loading of nanocrystals.
| Samples | Contact Angle (°) | Image | Surface Energy (mN/m) | Porosity (%) |
Water Uptake (%) |
|---|---|---|---|---|---|
| CA13 | 113.46 ± 1.46 |
|
20.01 ± 0.86 | 0.89 ± 0.04 | 13.67 ± 0.65 |
| CA13/HA50 | 53.46 ± 0.58 |
|
53.76 ± 0.96 | 0.98 ± 0.51 | 26.20 ± 0.46 |
| CA13/HA/BER100 | 56.46 ± 0.56 |
|
56.66 ± 0.92 | 0.99 ± 0.23 | 25.62 ± 0.56 |
| CA13/HA/ME100 | 103.46 ± 1.04 |
|
20.45 ± 0.86 | 1.01 ± 0.79 | 26.18 ± 0.58 |
The results are the means ± SD in each sample.