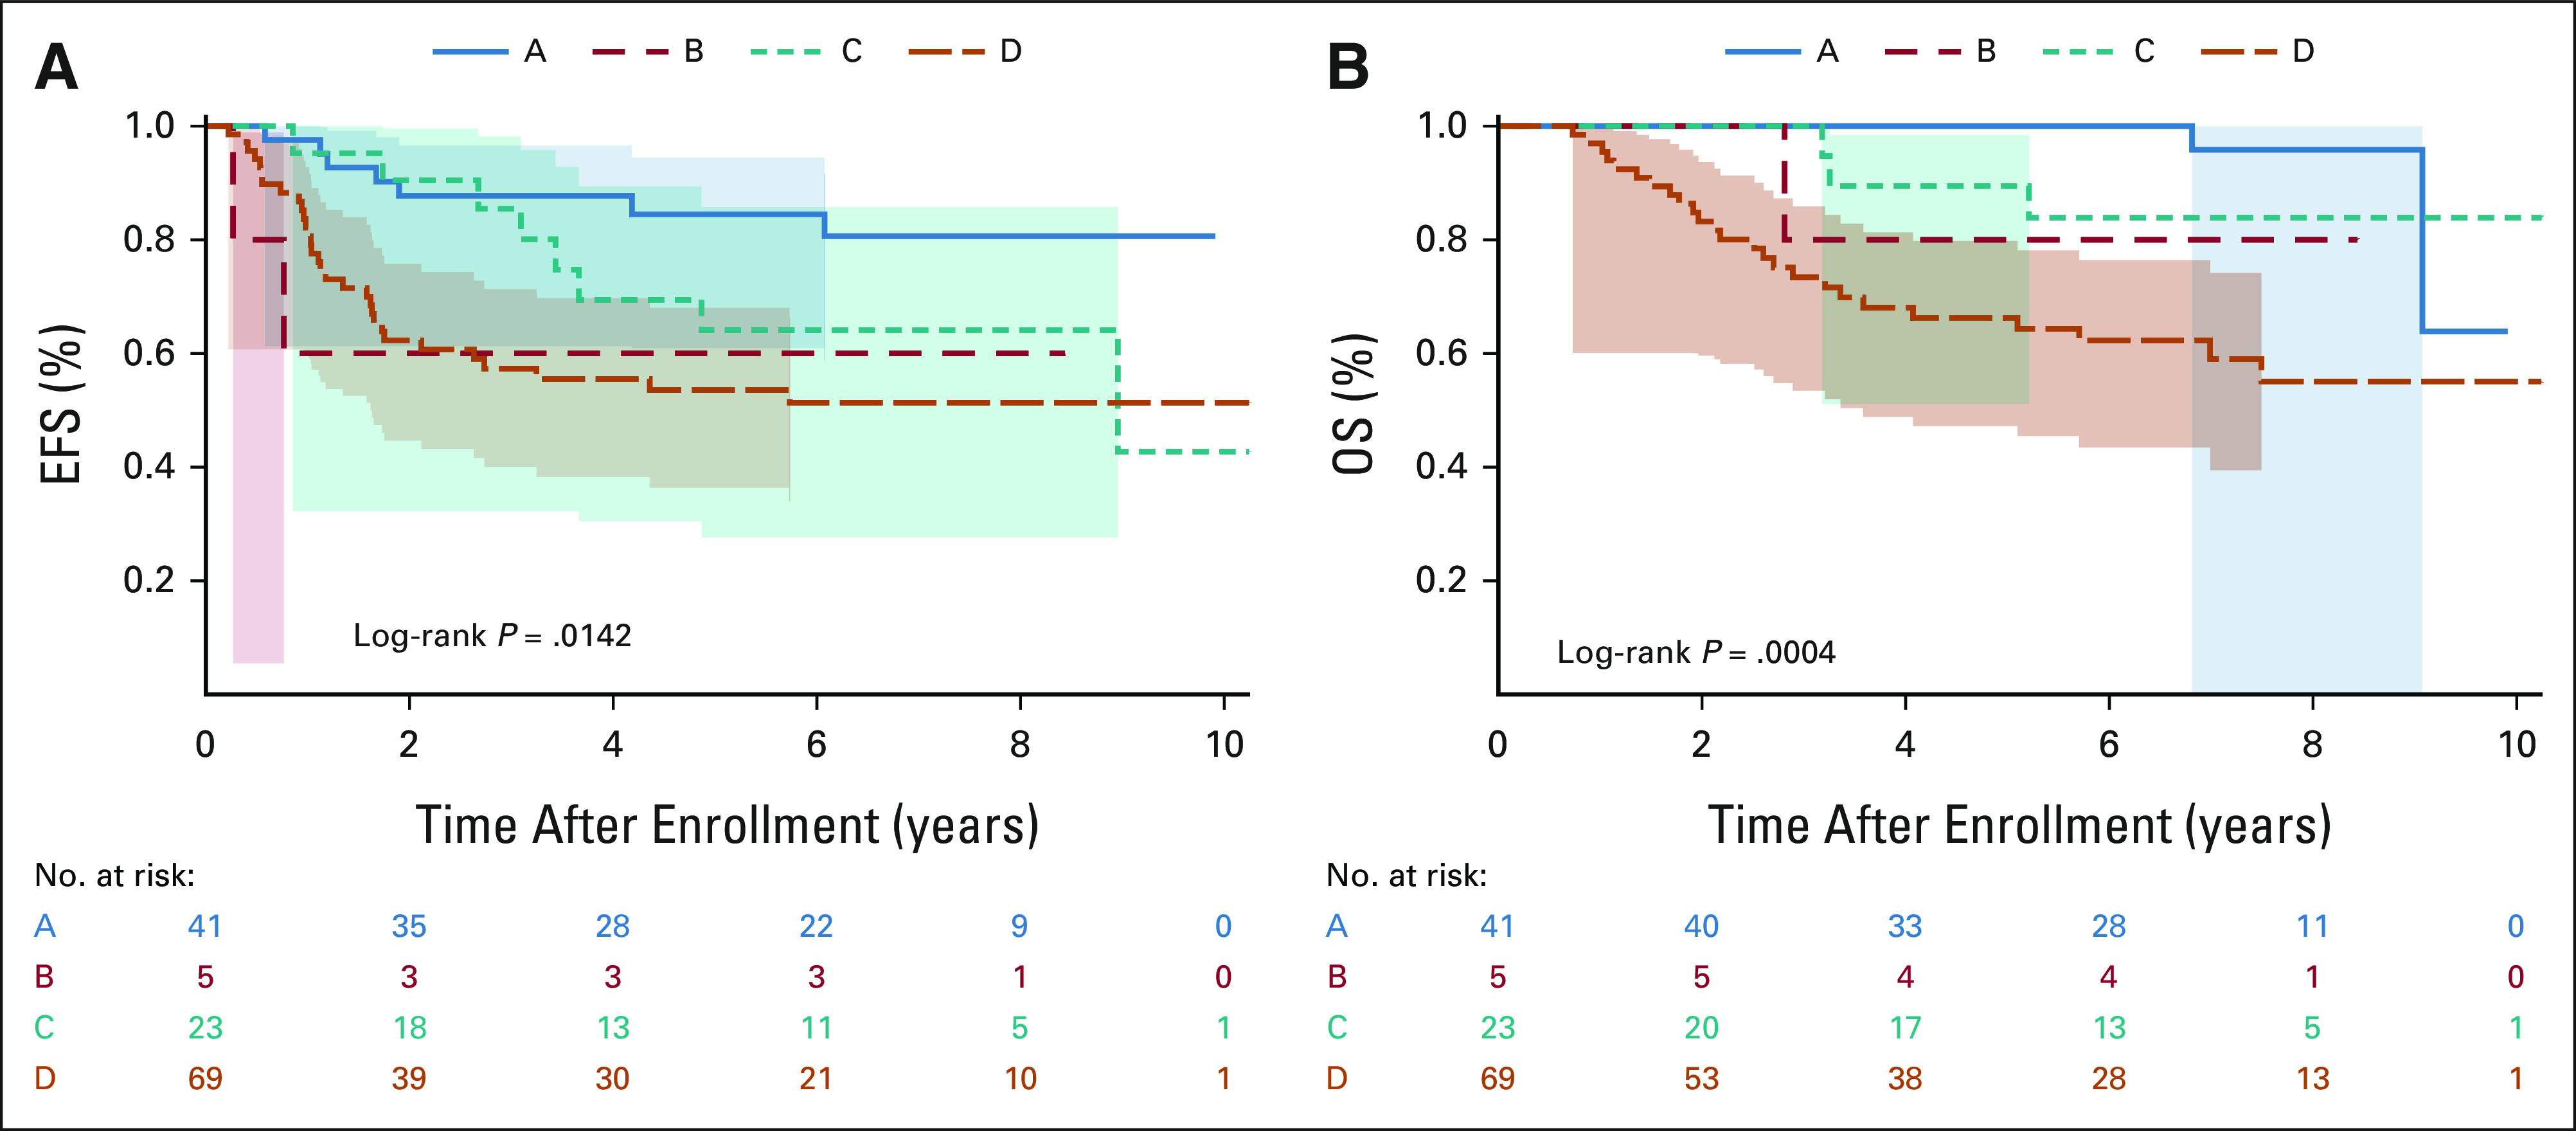
FIG 4.

EFS and OS by treatment arm. Kaplan-Meier curves representing (A) EFS and (B) OS for patients treated on arm A (surgery alone), arm B (RT), arm C (adjuvant chemoradiotherapy), and arm D (neoadjuvant chemoradiotherapy). EFS, event-free survival; OS, overall survival; RT, radiotherapy.
