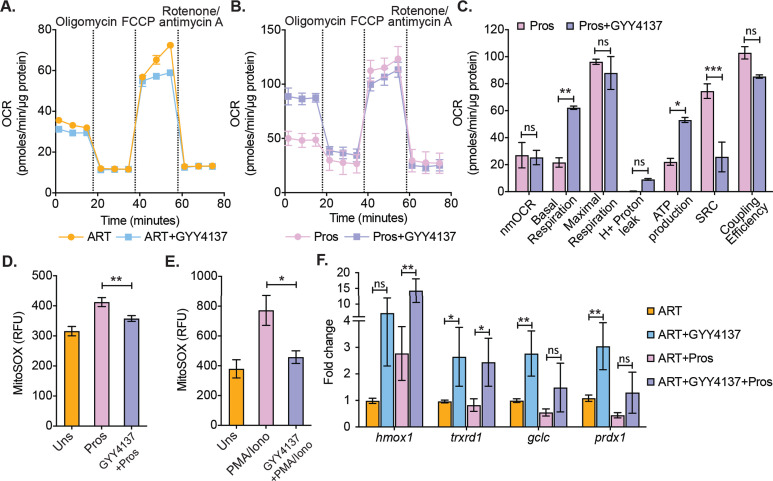
Figure 7. Effect of H2S on mitochondrial respiration and ROS generation in latent CD4+ T cells derived from HIV-1 patients.
(A) Primary human CD4+ T cells from HIV-1 infected subjects were activated and cultured ex vivo with ART or ART+GYY4137. On day 28, cells from ART or ART+GYY4137 treatment groups were harvested to assess mitochondrial respiration by using Seahorse XF mito-stress test as described in Materials and methods. (B) Cells from ART and ART+GYY4137 treated groups were stimulated with 1 μM prostratin 6 hr. Post-stimulation mitochondrial respiration profile was determined by Seahorse XF mito-stress test. (C) Various mitochondrial respiratory parameters derived from OCR measurement were determined by Wave desktop software. nmOCR; non-mitochondrial oxygen consumption rate and SRC; spare respiratory capacity. (D) On day 28, cells from both ART and ART+GYY4137 treatment groups were stimulated with 1 μM Prostratin for 6 hr. Cells were harvested and stained with 5 μM MitoSOX-Red dye for 30 min followed by washing. Samples were analyzed by flow cytometry. Unstimulated (Uns)- cells cultured under ART alone. (E) Both ART and ART+GYY4137 treated cells at day 14 post-activation were stimulated with 1 μg/ml PMA and 100 μg/ml ionomycin (Iono) for 6 h. Cells were harvested post-stimulation and stained with 5 μM MitoSOX-Red dye. Samples were analyzed by flow cytometry to assess mitoROS generation. Unstimulated (Uns)- cells cultured under ART alone. (F) CD4+ T cells from ART and ART+GYY4137 treated groups were stimulated with 1 μM prostratin on 28th day for 24 hr or left unstimulated. Cells were harvested to isolate total RNA and expression of hmox1, txnrd1, gclc, and prdx1 were determined by RT-qPCR. Data obtained were normalized to internal control β2 microglobulin (B2M). Error bar represents standard deviations from mean. Results are representative of data from three patient samples. *, p<0.05; **, p<0.01, by two-way ANOVA with Tukey’s multiple comparison test. RT-qPCR, reverse transcription quantitative PCR.

