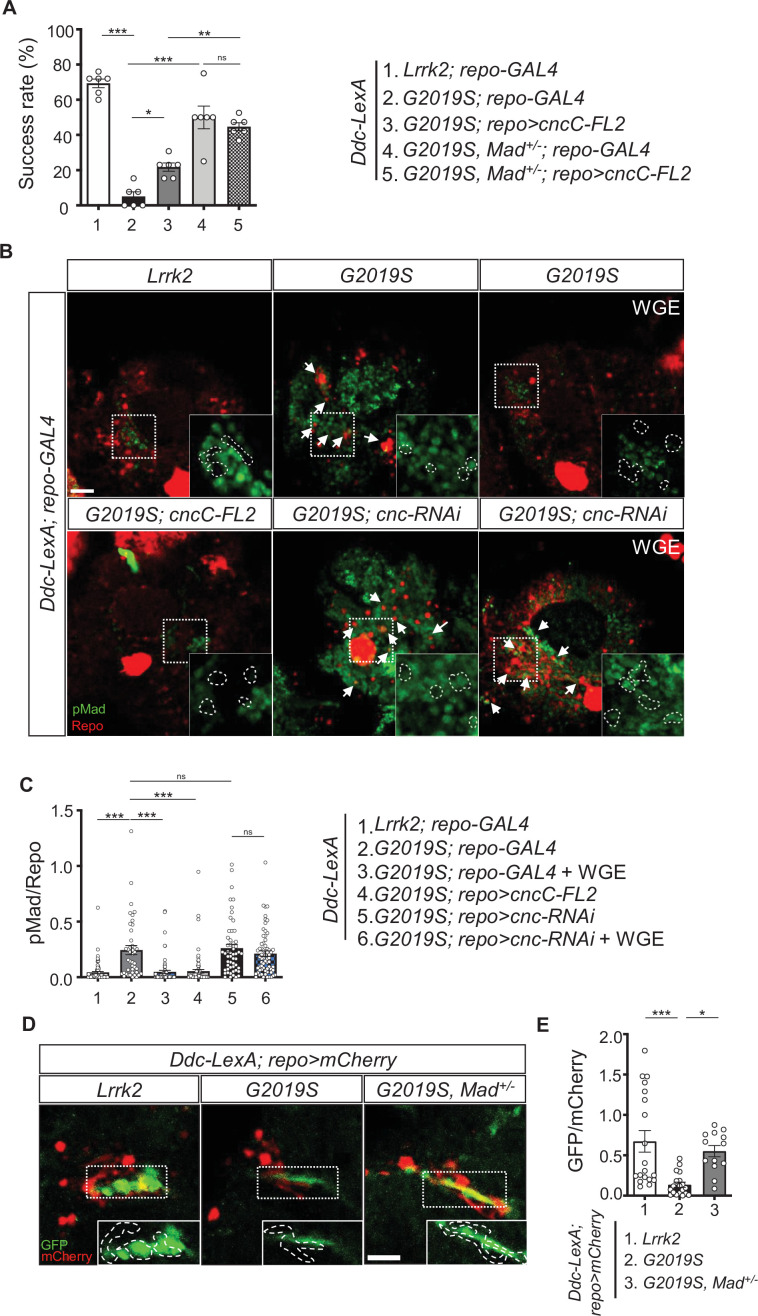
Figure 8. Nrf2 antagonizes BMP/Mad signaling in glia.
(A) Heterozygosity of Mad suppresses G2019S mutation-induced locomotion impairment in a negative geotaxis assay. Bar graph shows percentages (mean ± SEM, N = 6) of 6-week-old flies that climbed above 8 cm within 10 s. One-way ANOVA and Tukey’s post-hoc multiple comparison test: *p<0.05, **p<0.01, ***p<0.001, ns, not significant. (B) Representative images of pMad staining in the adult brains of Ddc-LexA>Lrrk2 or Ddc-LexA>G2019S flies in which repo-GAL4 drives expression of cncC-FL2 or cnc-RNAi. Impact of WGE treatment is shown in the rightmost panels. Arrows indicate pMad and Repo dual-positive cells. Insets are enlarged images of the dashed boxes, and dashed lines encompass Repo-positive cells. Bar: 20 μm. (C) Quantification of the ratio of pMad to Repo (mean ± SEM, N > 40). One-way ANOVA and Tukey’s post-hoc multiple comparison test: ***p<0.001, ns, not significant. (D) Images show pan-glial ARE-GFP expression (repo>mCherry) in Ddc-LexA>Lrrk2, Ddc-LexA>G2019S, and Ddc-LexA>G2019S, Mad+/- fly brains. GFP channels within the dashed boxes are shown as enhanced views in the inset, with glial signals outlined by dashed lines. Bar: 20 μm. (E) Quantification for GFP expression levels (mean ± SEM, n > 13). One-way ANOVA and Tukey’s post-hoc multiple comparison test: *p<0.05, ***p<0.001.

