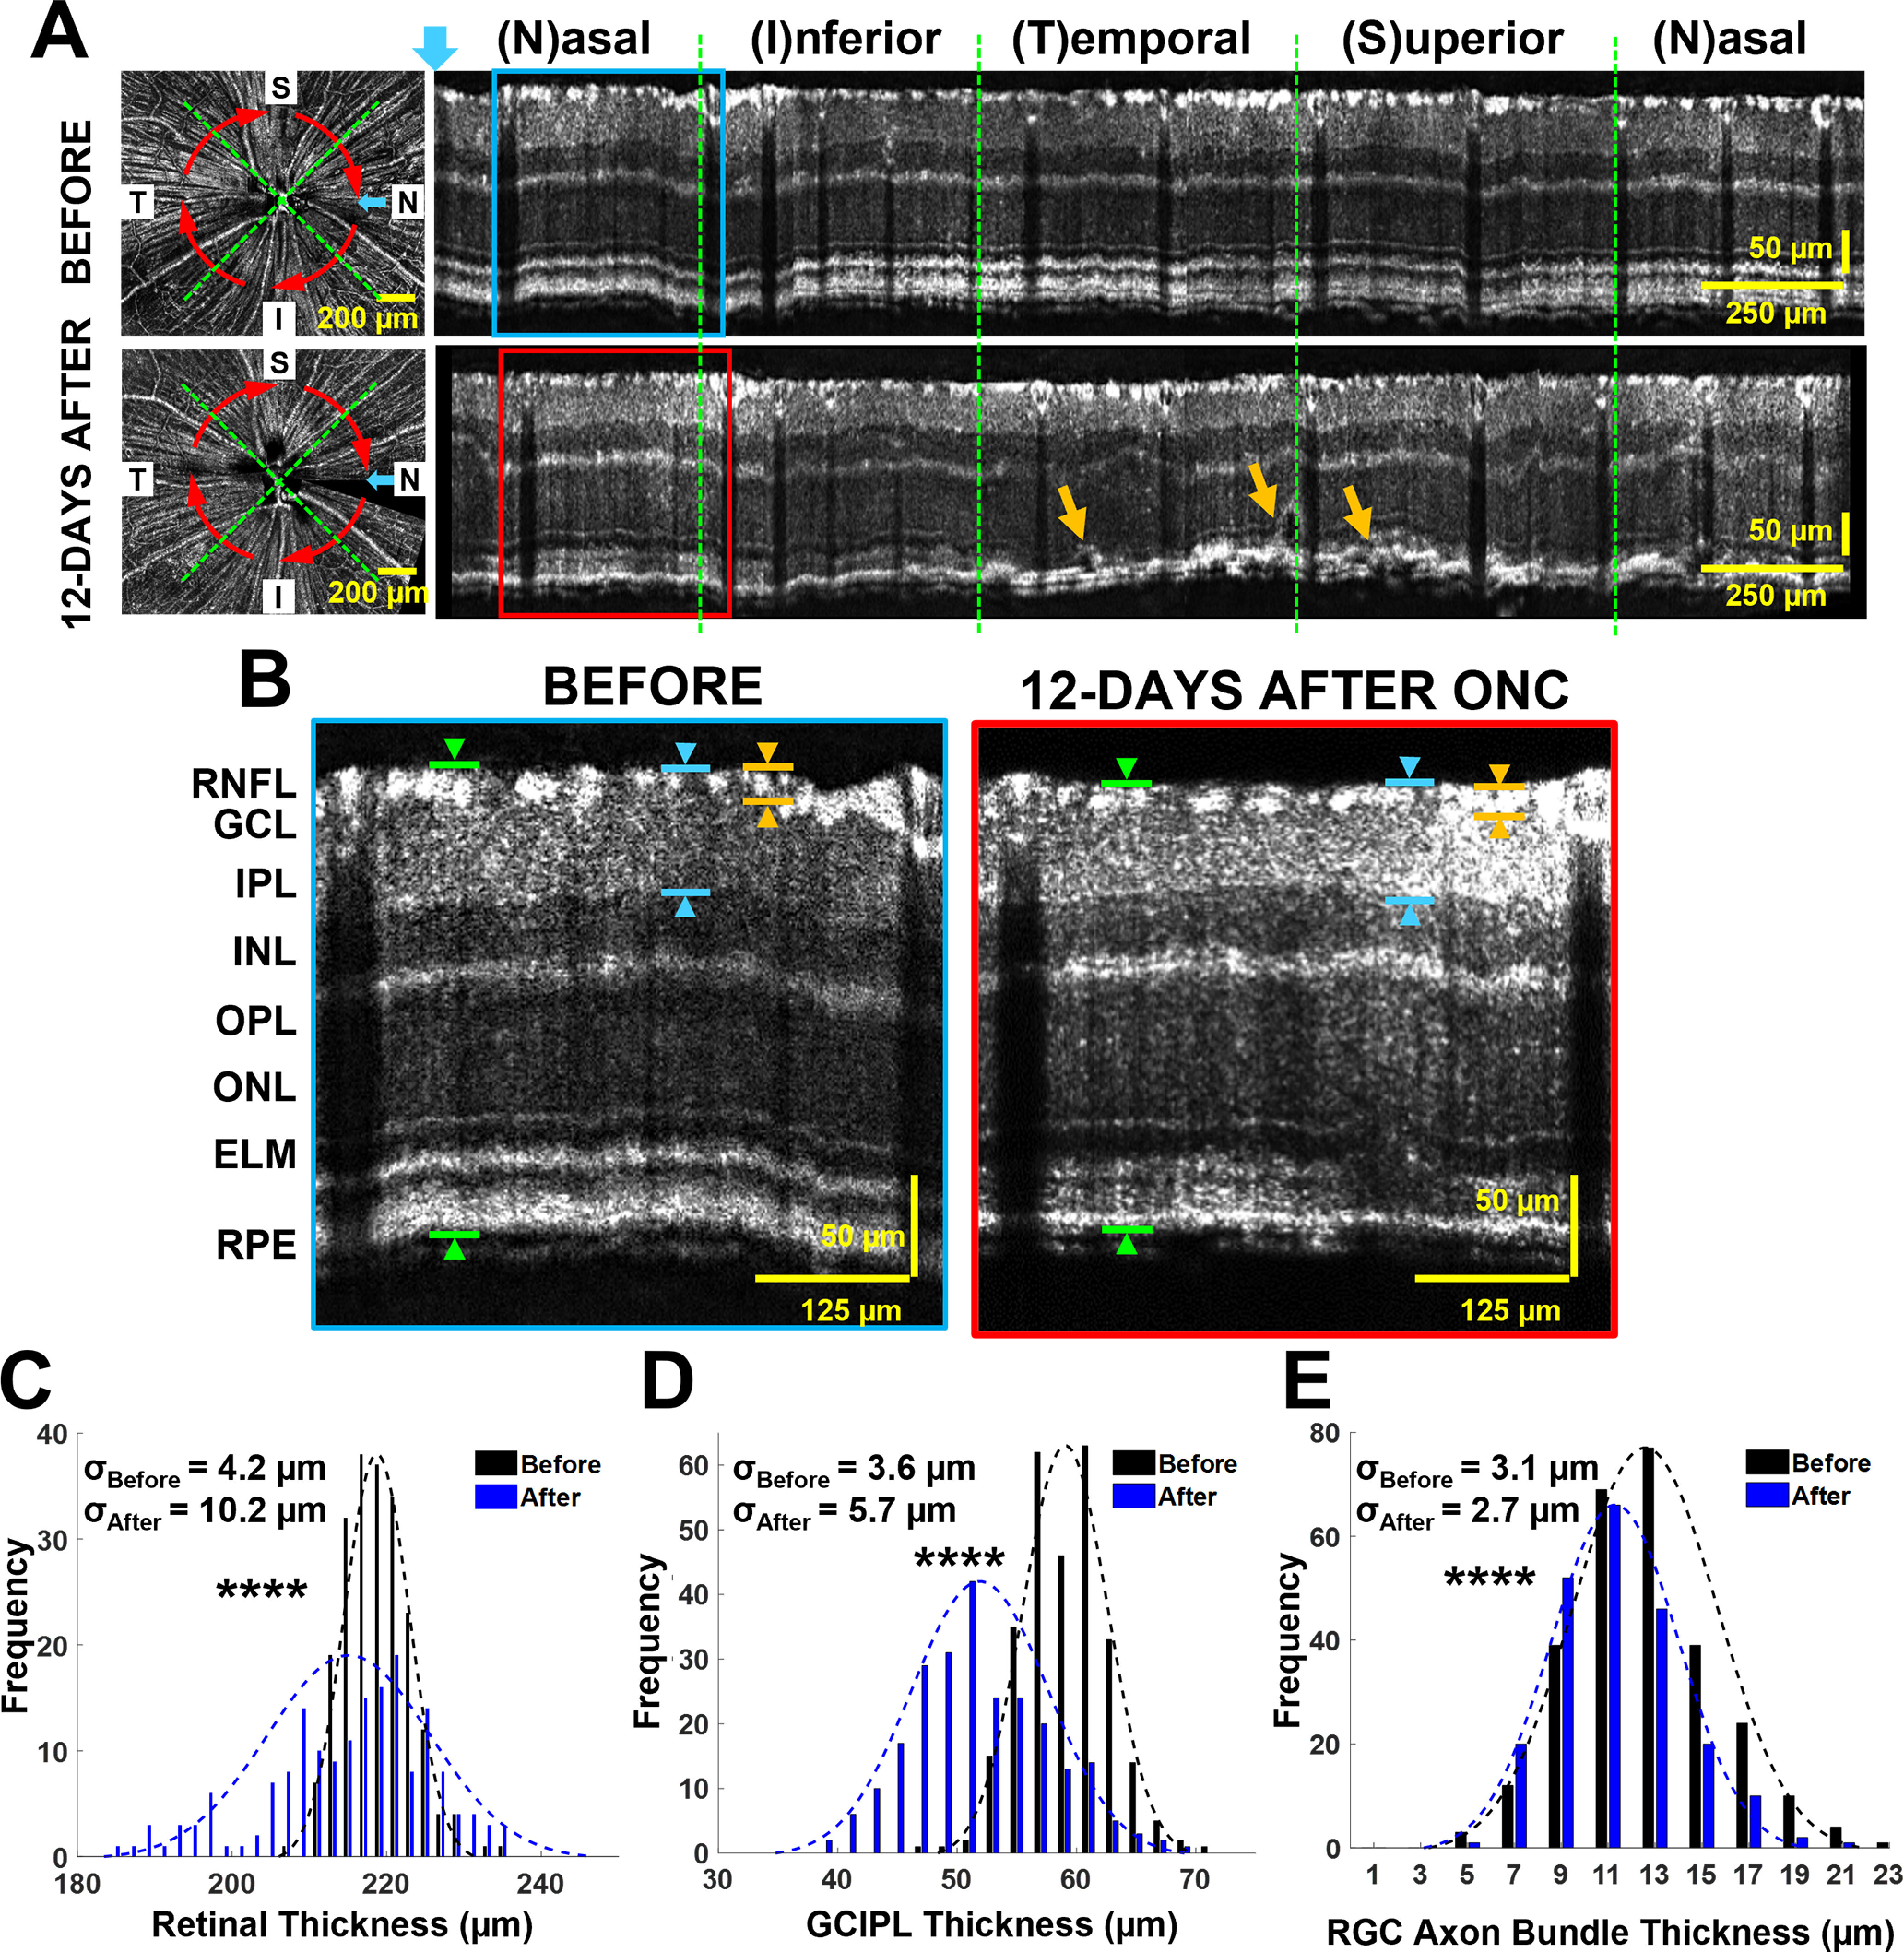
Figure 3.

At 12 d after ONC injury, mice exhibited reduced retinal and RGC axon bundle thickness. A, Fibergrams and circumpapillary B-scans before (top panels) and 12 d after ONC (bottom panels). The blue arrow indicates the left-most A-line in circumpapillary B-scans, and the red arrows indicate the direction and location of reconstructed circumpapillary B-scans. The orange arrows in the bottom panel indicate localized edema. B, Magnified view of boxed regions indicated in panel A. The green arrows exemplify retinal thickness measurement, the blue arrows exemplify the GCIPL measurements, and the orange arrows exemplify RGC axon bundle thickness measurement. C, Distribution of retinal thickness measurements in retinas before (black) and 12 d after crush (blue). D, GCIPL measurements in retinas before (black) and 12 d after crush (blue). E, RGC axon bundle thickness measurements in retinas before (black) and 12 d after crush (blue; ****p < 0.0001); σ values represent the SD of distributions.
