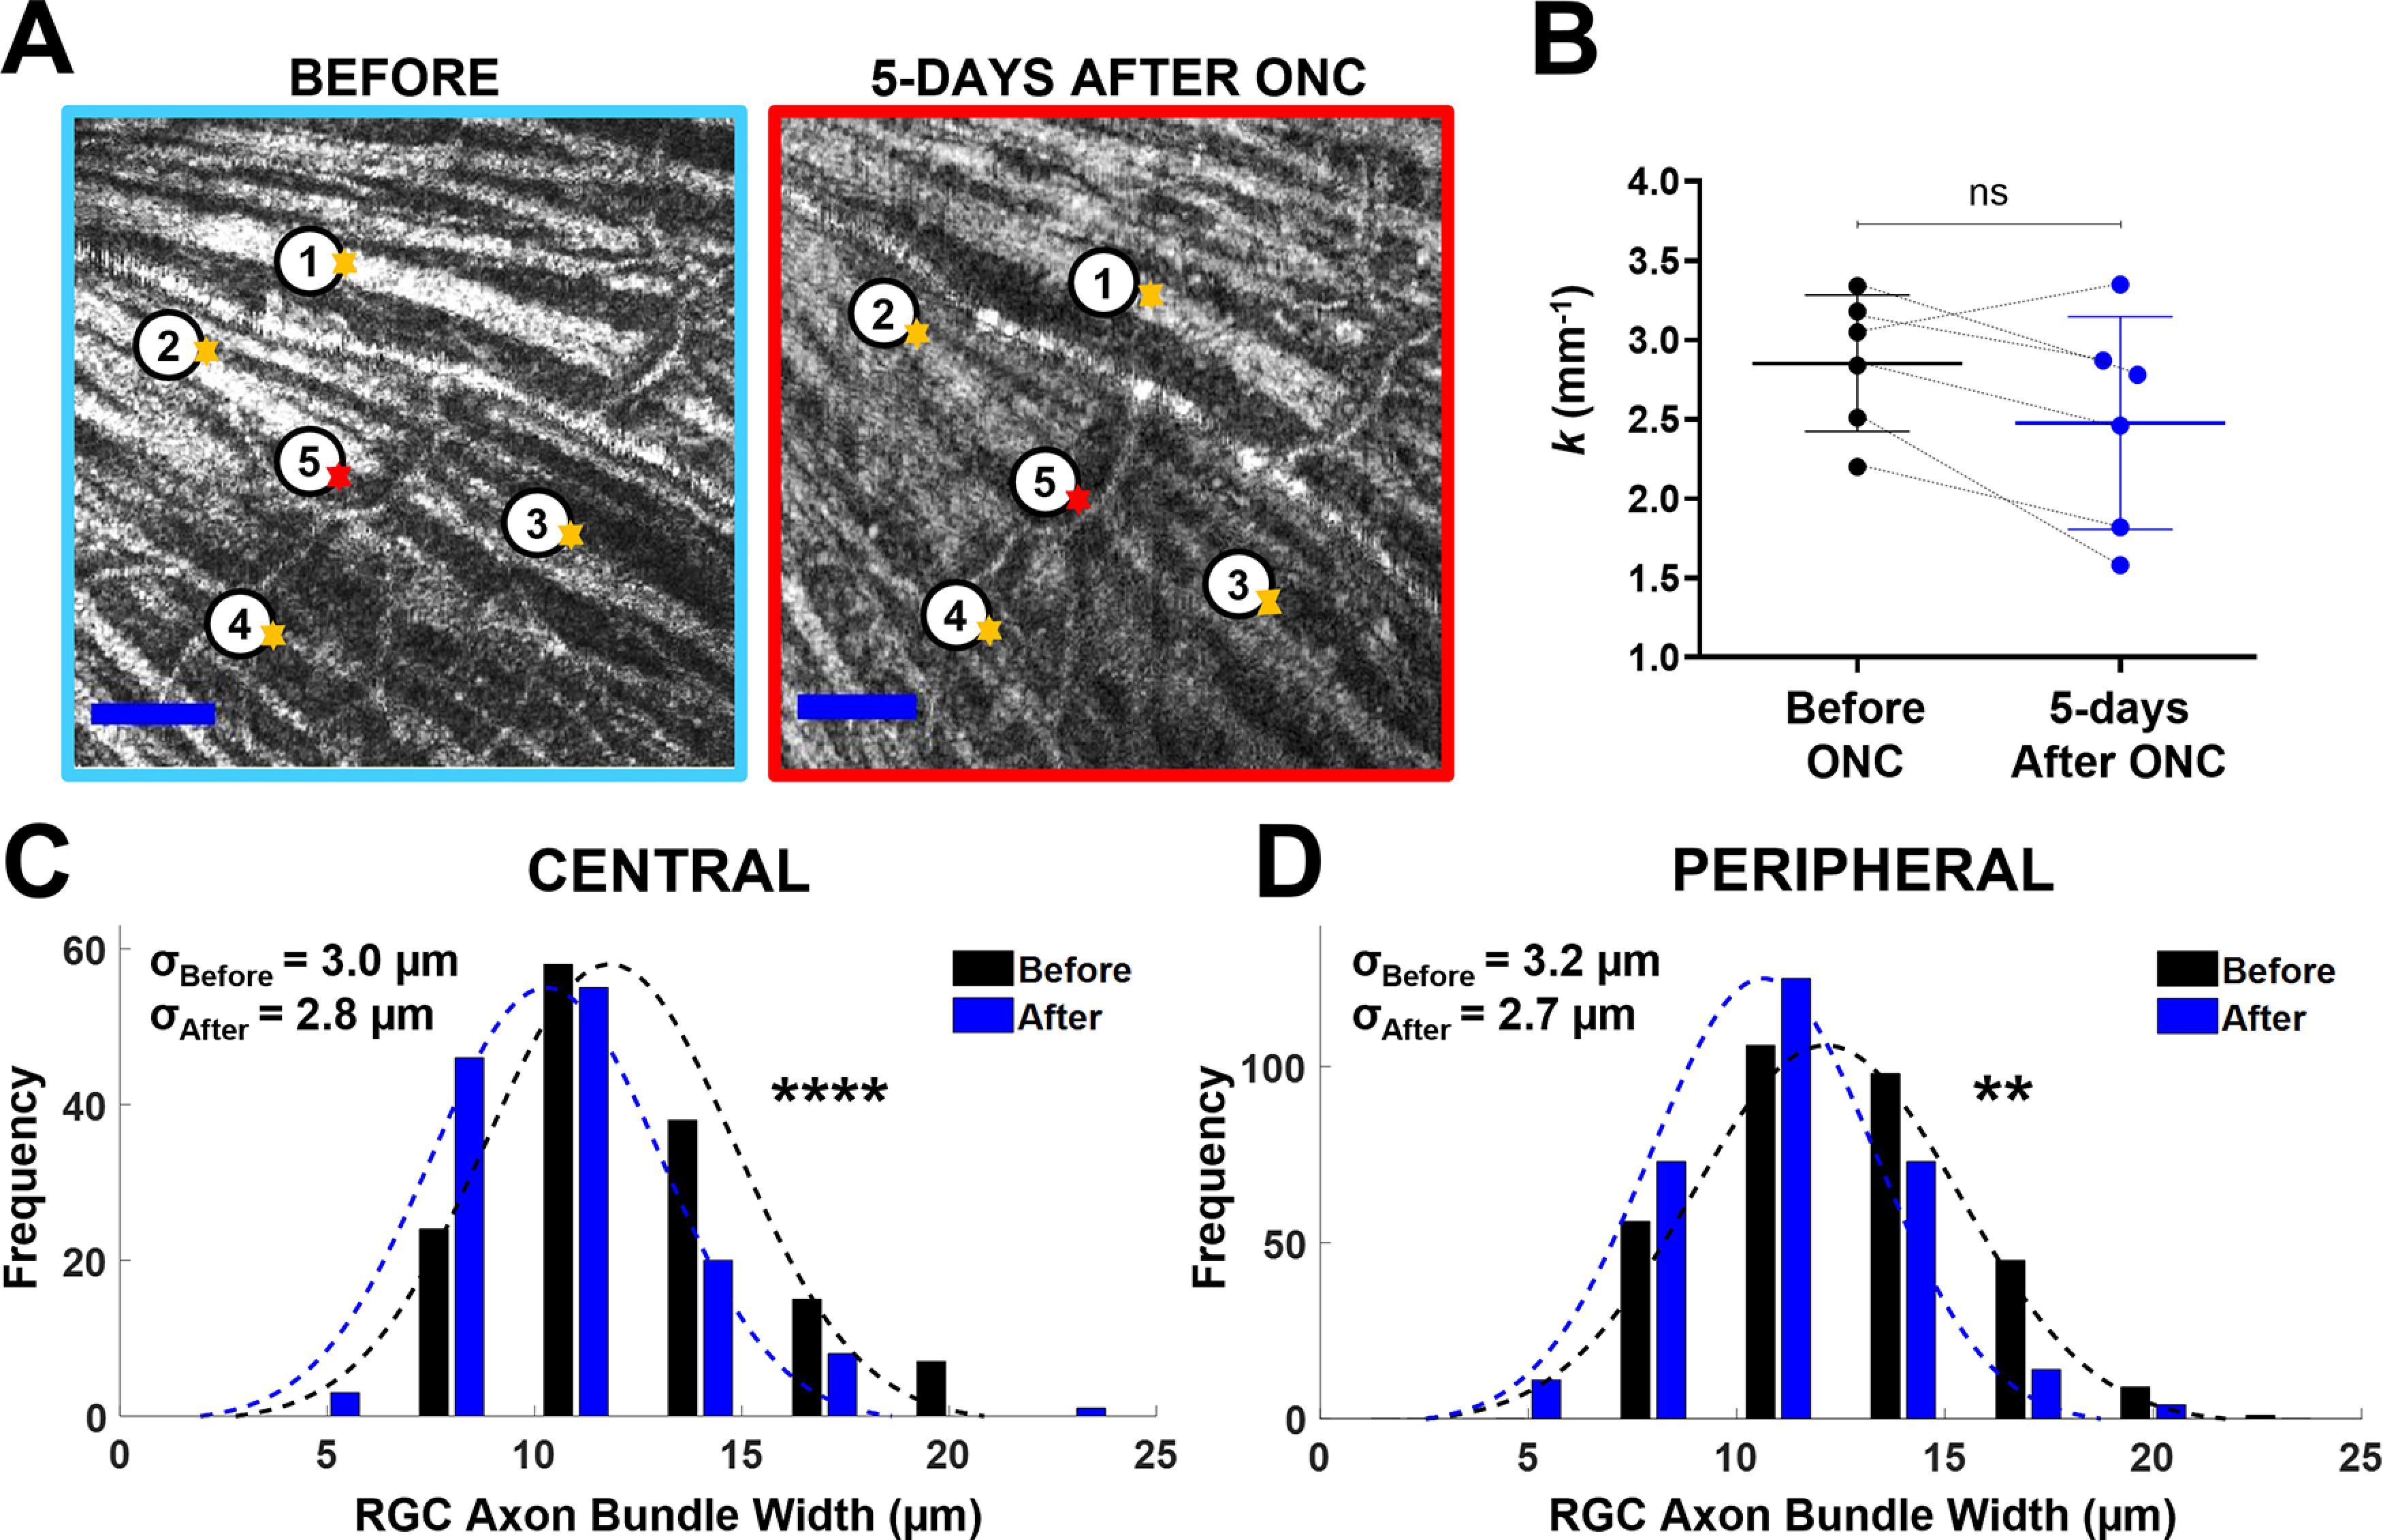
Figure 7.

At 5 d after ONC, RGC axon bundle width reduced, but no change in bundle density. A, vis-OCT fibergrams before (left) and 5 d after (right) ONC. The orange arrows indicate RGC axon bundles, and the red arrows indicate blood vessels. B, The k values for mice before (black) and after ONC (blue). The black dashed lines track measurements for individual retinas before and after ONC. C, D, RGC axon bundle width distributions measured from the central (C) and the peripheral retina (D; NS: no significance; ****p < 1e-4); σ values indicate SDs.
