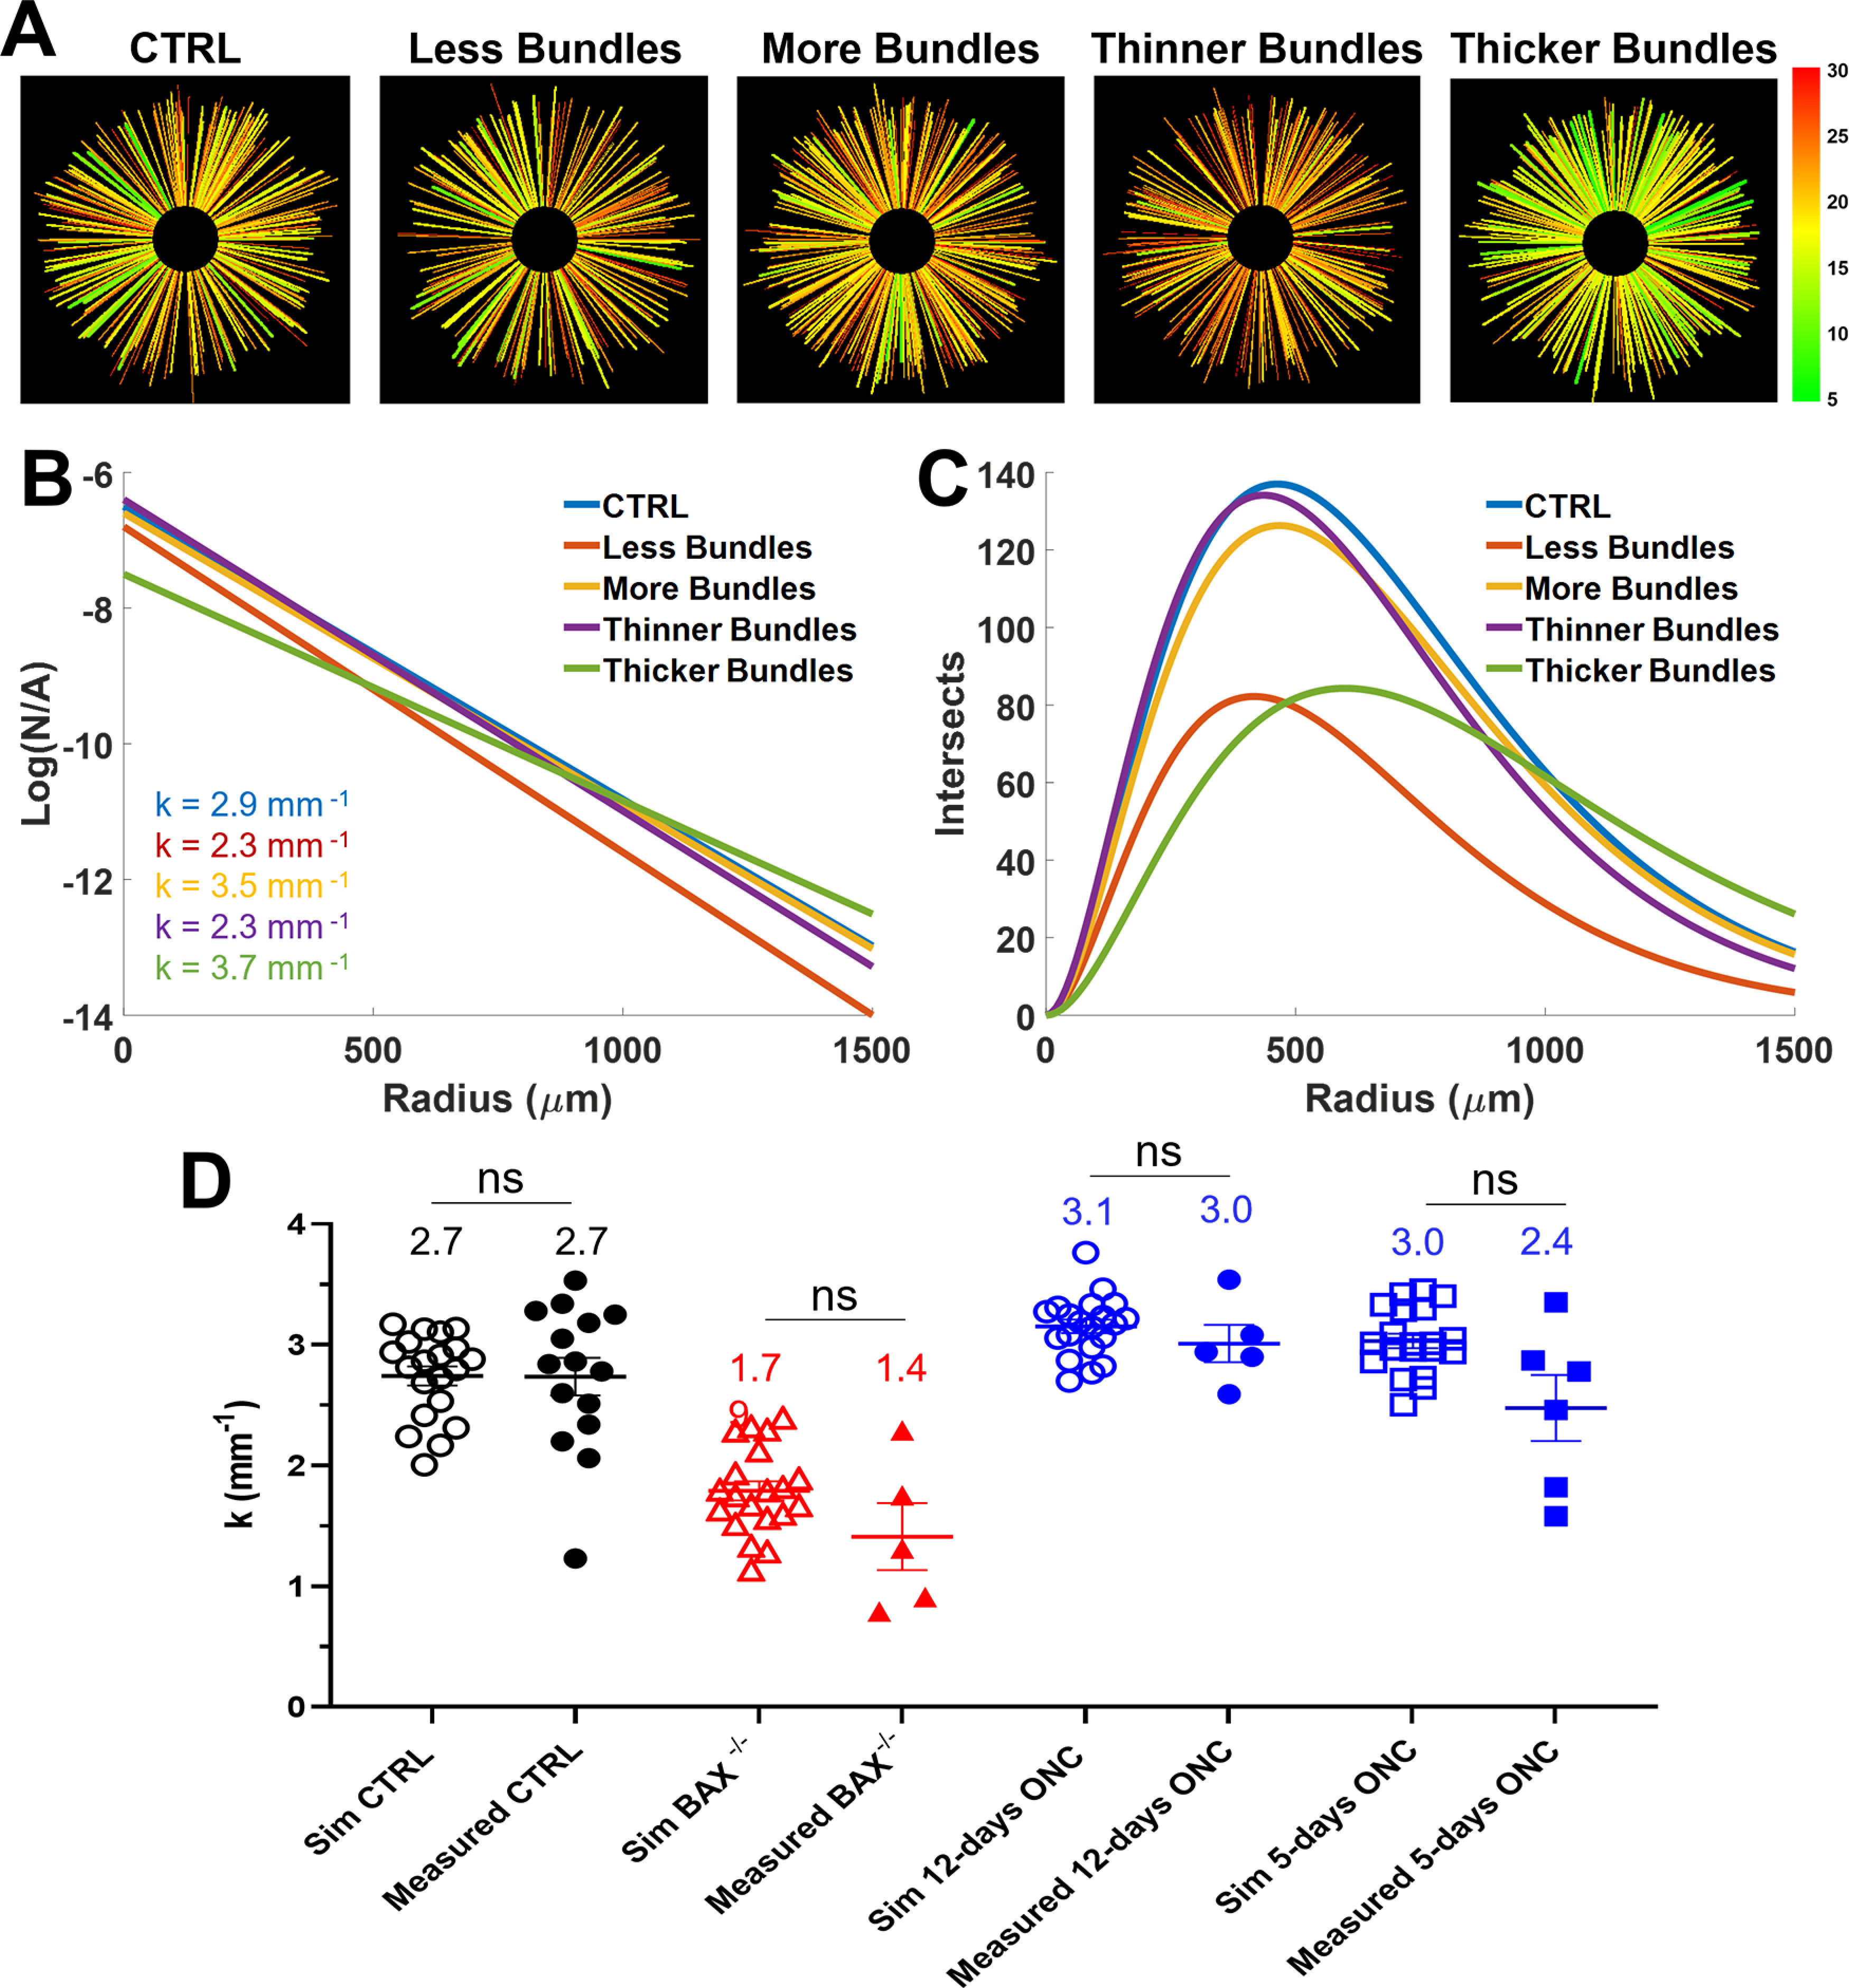
Figure 8.

Model for simulating the relationship between the k value and the axon bundle width and number. A, Simulated RGC axon bundle distributions. Simulated distributions include (from left to right): control (CTRL), low bundle density, high bundle density, thinner bundles, and thicker bundles. B, Average semi-log k value for each simulated condition shown in panel A. C, Average number of simulated intersects for simulated conditions shown in panel A. D, Comparison between simulated k values (open shapes) and measured k values (filled shapes) for control (black), BAX−/− (red), and ONC (blue) mice. Simulations were performed based on the measured width of RGC axon bundles for each condition (NS: no significance).
