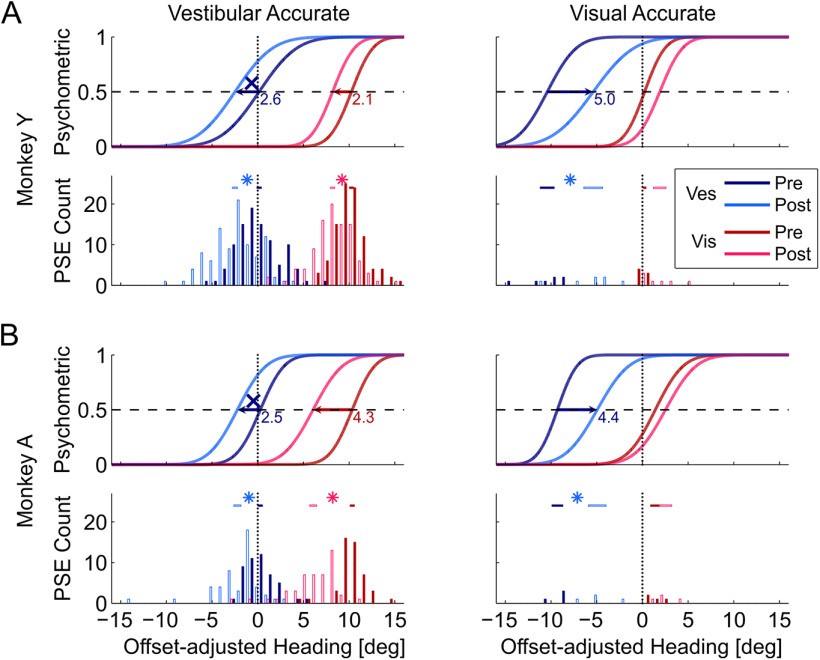
Figure 1.
Behavioral shifts during multisensory calibration. Behavioral responses from the recording sessions are presented for Monkey Y (A) and Monkey A (B), for the “vestibular accurate” and “visual accurate” conditions (left and right columns, respectively). All data are presented as though Δ = 10°, and data collected with Δ = −10° were flipped before pooling. Blue and red colors represent the vestibular and visual responses, respectively. Dark hues represent precalibration (baseline) behavior. Lighter hues represent postcalibration data. The psychometric plots (Gaussian cumulative distribution functions) represent the proportion of rightward choices as a function of heading, adjusted according to external feedback; that is, the visual “inaccurate” plots (left column) were shifted by 10°, and the vestibular “inaccurate” plots (right column) were shifted by −10°. Here, these represent the average behavior (per condition, cue, block, and monkey). Intersection of each psychometric function with the horizontal dashed line (y = 0.5) marks the PSE (perceptual estimate of straight ahead). Vertical dotted lines indicate the expected PSE for “accurate” perception, according to external feedback. PSE histograms present the data from all sessions. Horizontal bars above the PSE histograms represent the mean ± SEM intervals. Significant shifts (p < 0.05) are marked by asterisk symbols above the histograms, and by horizontal arrows on the psychometrics (with the shift size presented in degrees). X represents significant shifts away from feedback (becoming less accurate).

