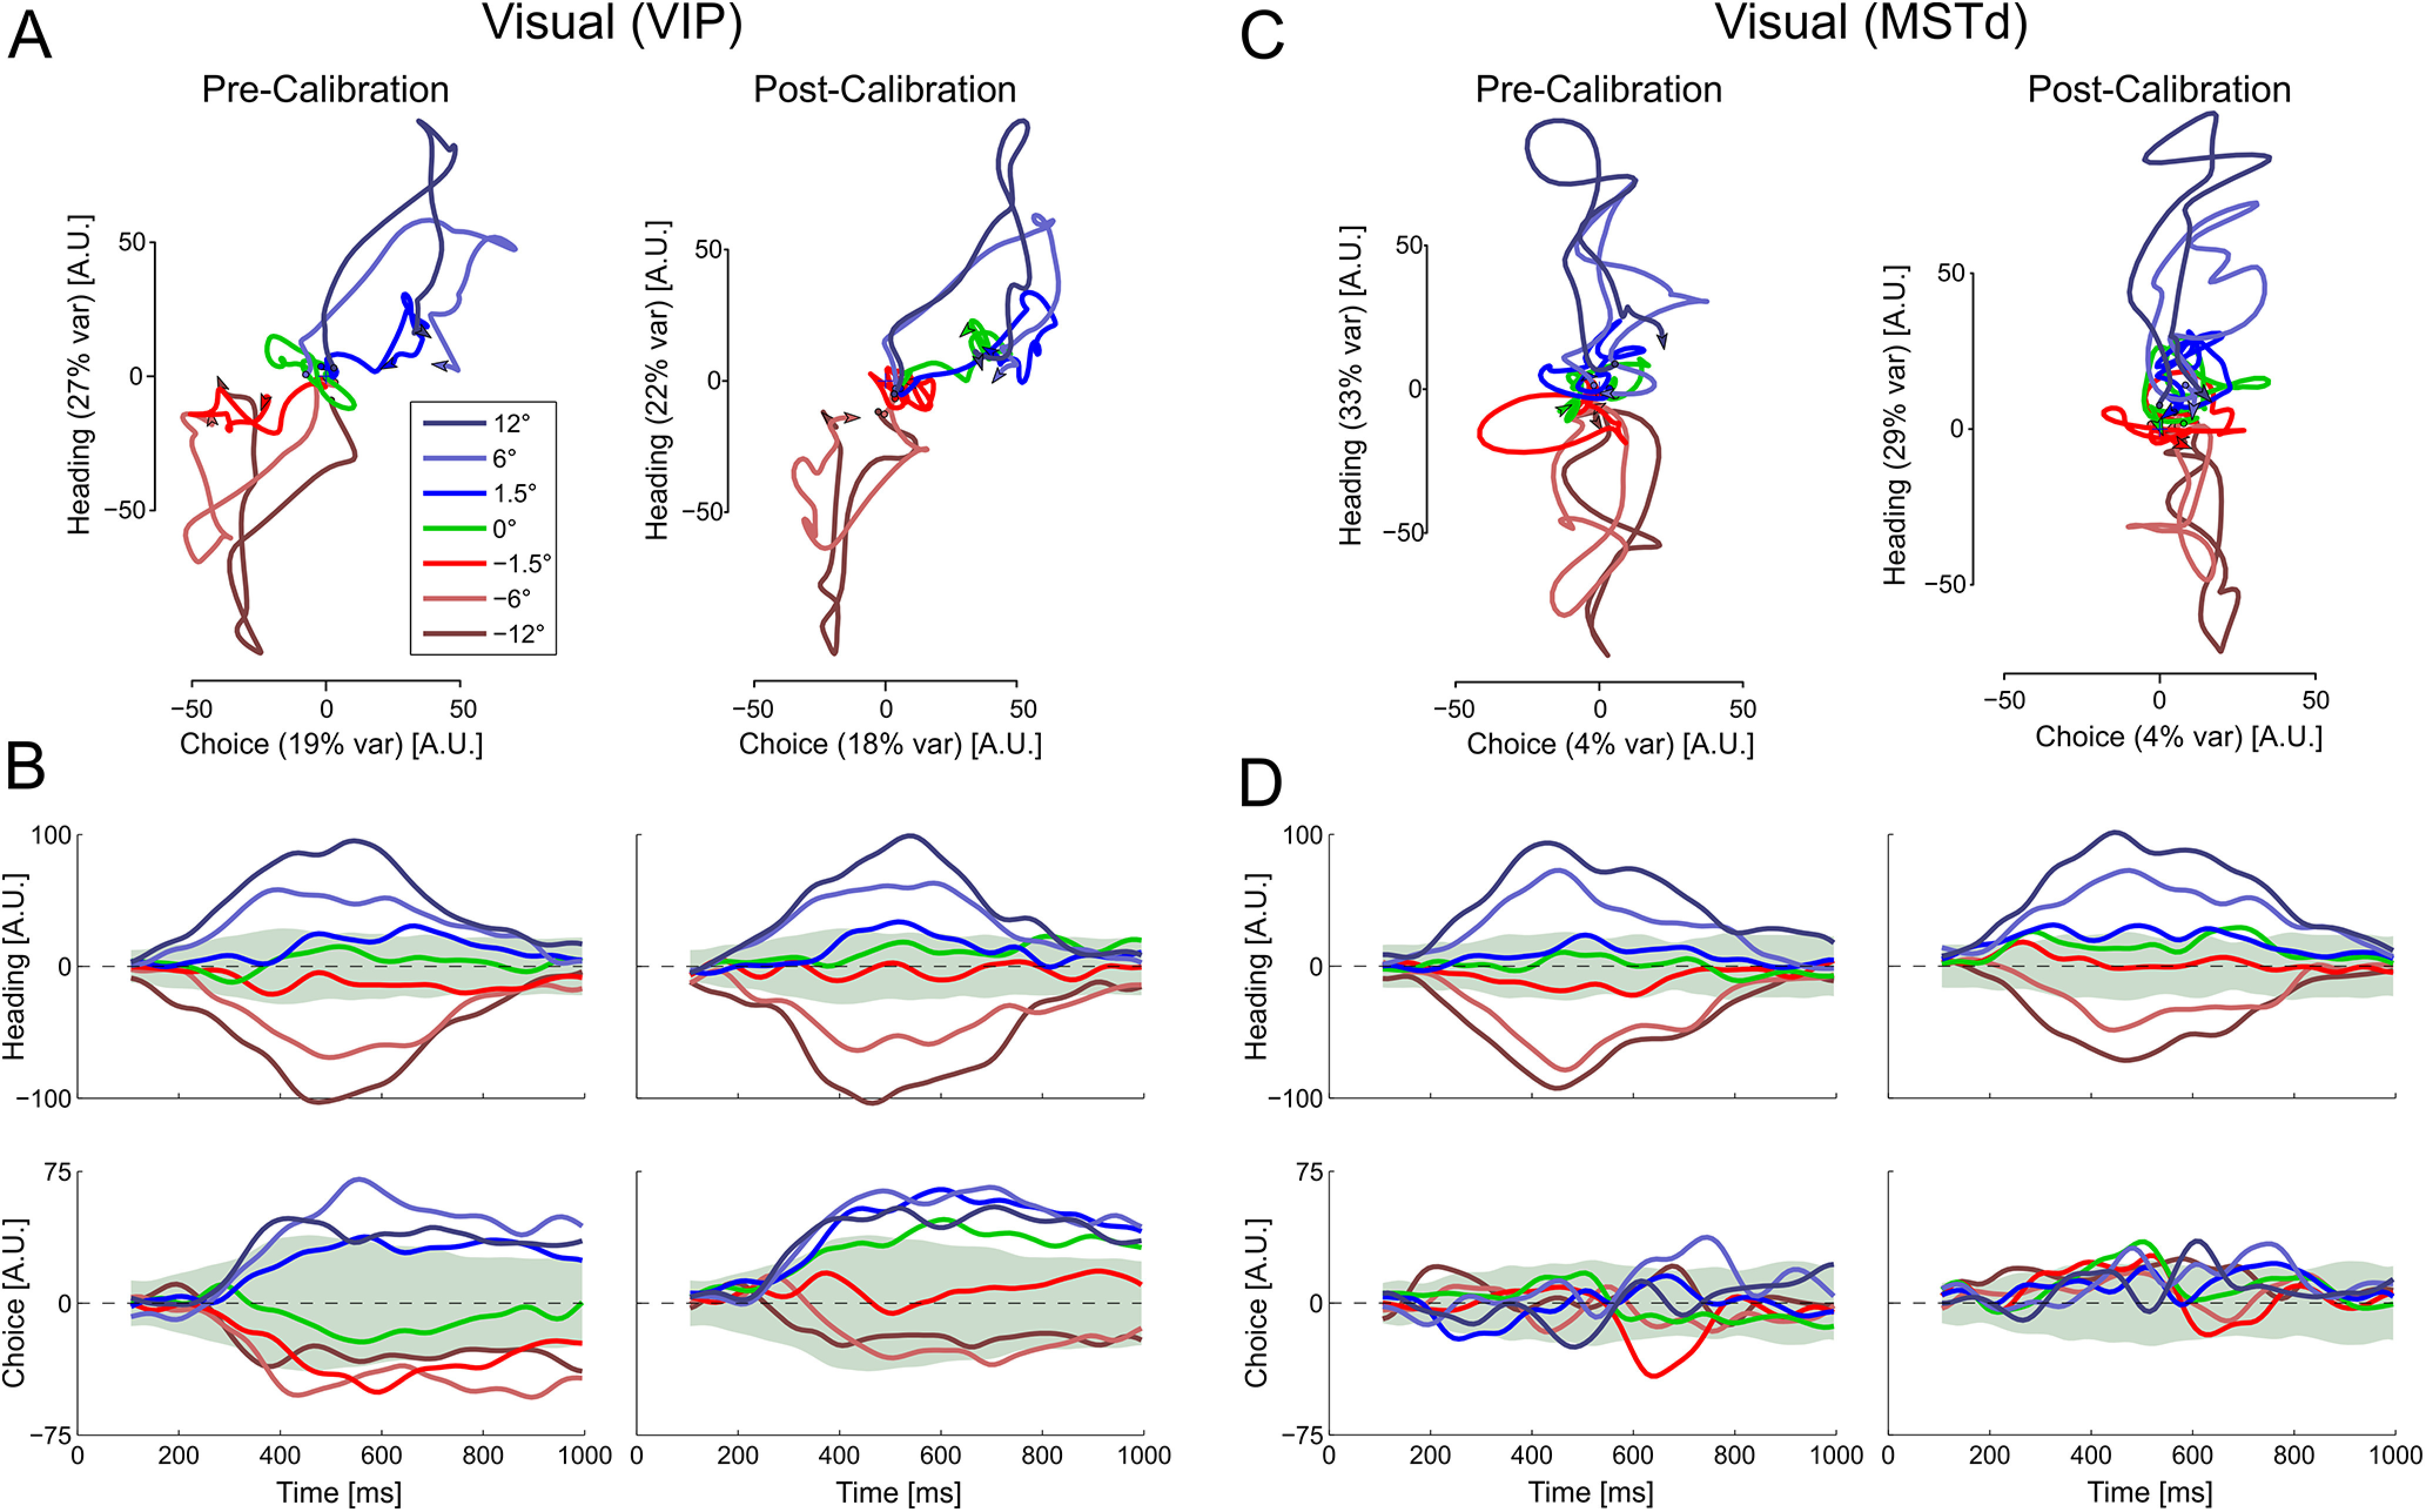
Figure 5.

Multisensory calibration of visual responses in state space. (A) VIP and (C) MSTd population responses for each heading direction are projected onto a two-dimensional state space that captures variance related to heading (stimulus) and choice. Time is embedded within the state space trajectories (these start around the origin; arrows indicate the end of each trajectory). B, D, State space projections for VIP and MSTd, respectively, as a function of time. The state space axes were constructed from the precalibration responses (using only neurons that were stable both precalibration and postcalibration). Responses of these same neurons were projected both precalibration and postcalibration onto the same axes (left and right columns, respectively, in each subplot). Data are presented as Δ = 10° (data collected with Δ = −10° were flipped). Green shaded regions represent 95% distribution intervals (from surrogate data) for the 0° heading condition. The choice axis was orthogonalized relative to the heading axis. Therefore, the percentage of explained variance (presented in parentheses in A and C) represents the unique variance explained by choice, whereas the heading value represents its unique component plus any overlap between the two. Multisensory calibration is seen for VIP primarily in the choice domain as the projections shift toward more rightward choices. This is best seen for the 0° heading condition (green) and the near central headings (−1.5° and 1.5°). N = 182 for VIP, and N = 127 for MSTd.
