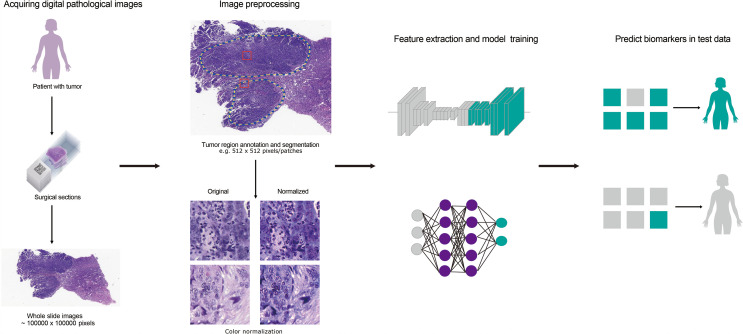
Figure 1.
The flow chart for predicting cancer-related biomarkers based on digital pathological images. Firstly, H&E stained histology slides of patients were obtained and whole slide images (WSIs) was obtained after scanning. Secondly, tumor regions were annotated by pathologists or through CNN model. Then, the regions were segmented to patches and color-normalized. Thirdly, feature extraction and model training were carried out according to biomarker labels. Finally, biomarker prediction was implemented in test dataset.

