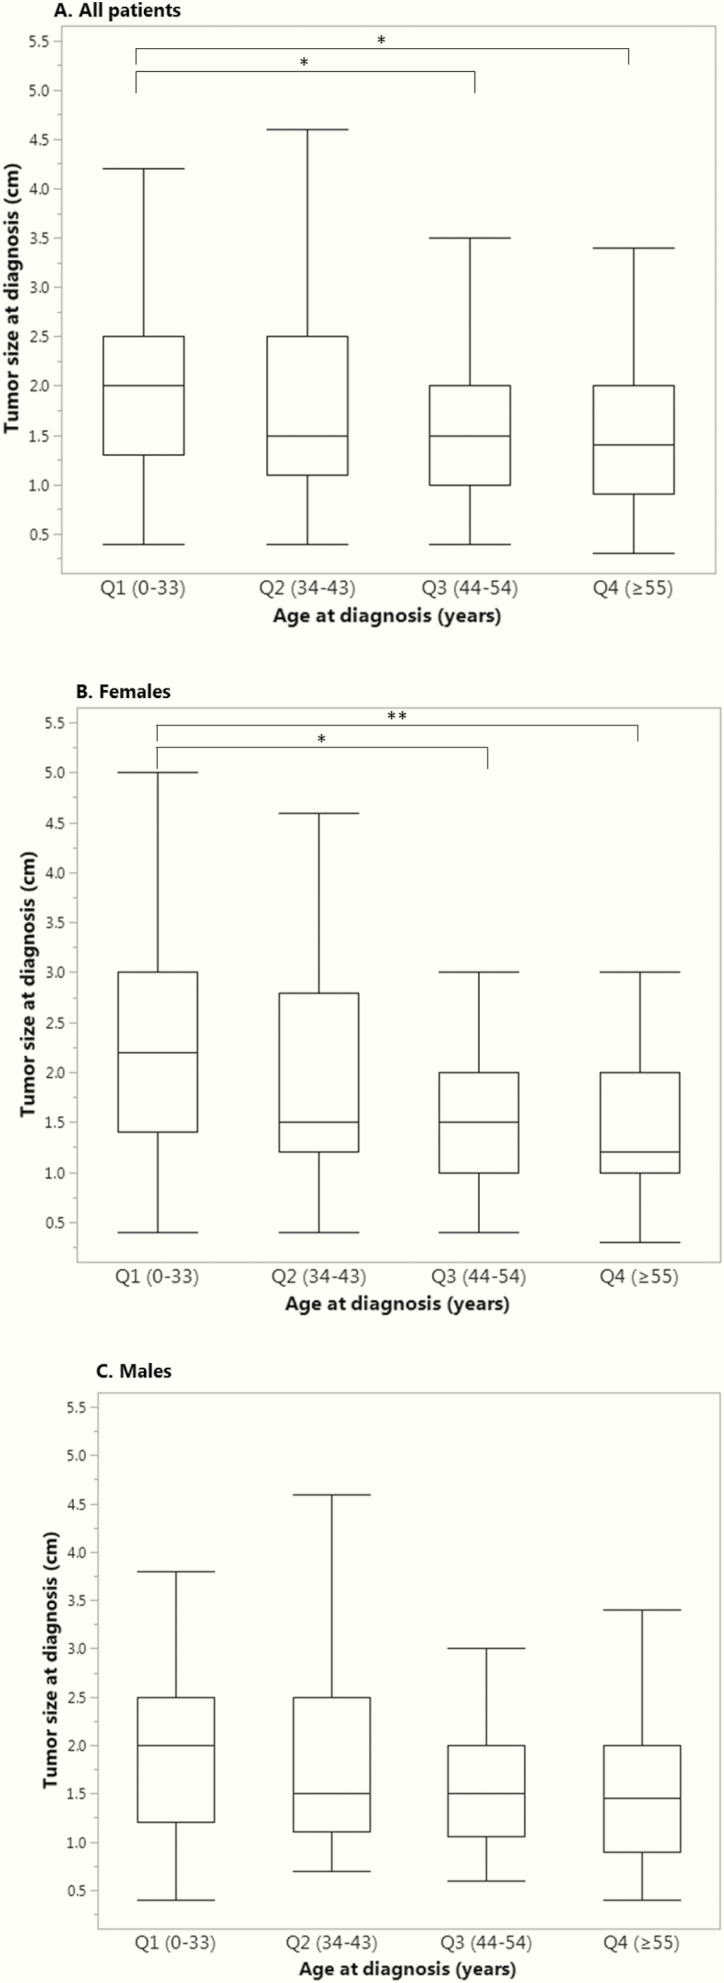
Figure 2.
Clinical characteristics and age of diagnosis.Tumor size was defined as maximal diameter (cm) on magnetic resonance imaging at time of diagnosis. Age groups shown include quartiles 1 through 4 corresponding to age Q1 (0–33), Q2 (34–43), Q3 (44–54), Q4 (≥55) years old, respectively.
A. Tumor size and age of diagnosis for all the patients (N = 325), *P < 0.001
B. Tumor size and age of diagnosis in women (N = 178), *P = 0.004, **P = 0.002.
C. Tumor size and age of diagnosis in men (N = 147) (no significant difference between groups).

