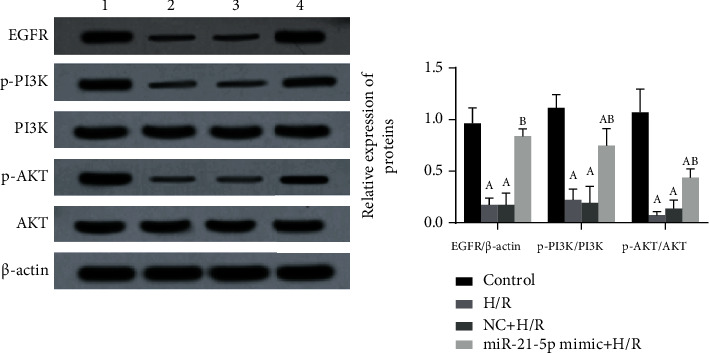
Figure 4.

The effects of miR-21-5p overexpression on the activation of the EGFR/PI3K/AKT signaling pathway (n = 3). The experimental groups are as follows: 1: control group; 2: H/R group; 3: NC+H/R group; 4: miR-21-5p mimic+H/R group. Note: Student's t-test was used. Compared with the control group, aP < 0.05; compared with the H/R group, bP < 0.05.
