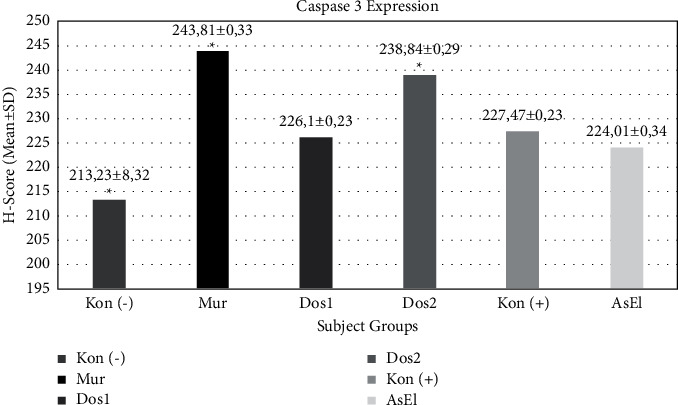
Figure 4.

The caspase-3 expression in mice crypt cells is indicated by the H-score. Data are presented in the form of mean ± standard deviation (N = 33). Kon(−) was the DSS group, Mur was the normal group, Dos 1 was dose 1: pomegranate peel extract of 240 mg/kg/day, dose 2 (Dos 2) was the pomegranate peel extract of 480 mg/kg/day, Kon (+) was aspirin, and AsEl group was treated with aspirin and pure ellagic acid. ∗Significant differences with the DSS group (p < 0.05); ∗∗no significant differences among dose 1, ASP, and ELA. DSS group, (NORM): normal group, dose 1 (Dos 1): pomegranate peel extract of 240 mg/kg/day, dose 2 (DOS2): pomegranate peel extract of 480 mg/kg/day, ASP: aspirin, and ELA: pure ellagic acid.
