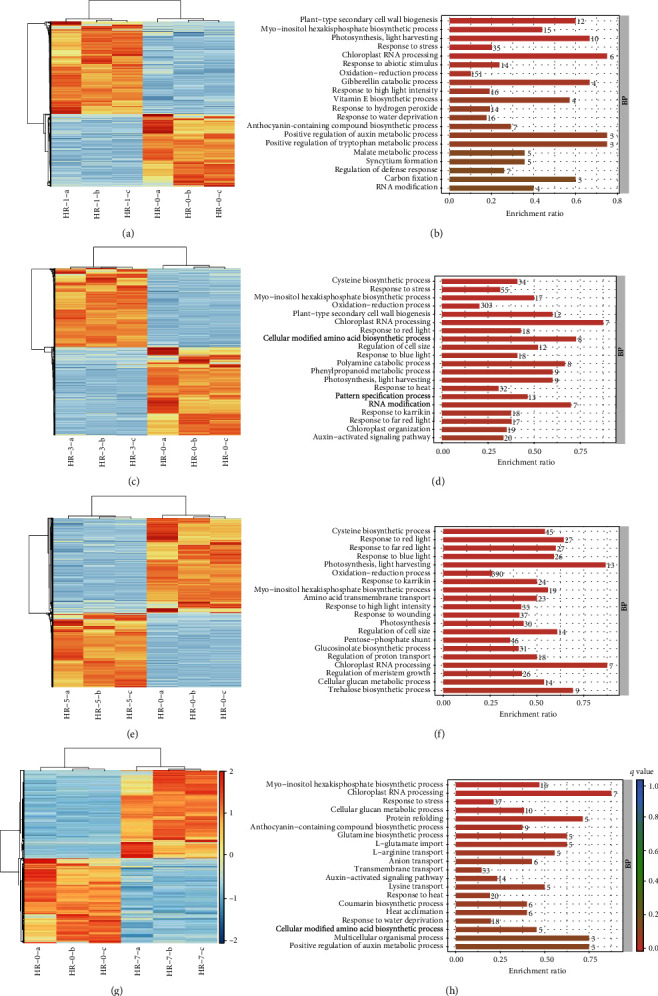
Figure 4.

The GO analysis of differentially expressed genes (DEGs) from HR-1 vs. HR-0, HR-3 vs. HR-0, HR-5 vs. HR-0, and HR-7 vs. HR-0. (a, c, e, and g) Heatmaps for DEGs from HR-1 vs. HR-0, HR-3 vs. HR-0, HR-5 vs. HR-0, and HR-7 vs. HR-0, respectively. Heatmaps were generated from the hierarchical analysis of genes and samples. (b, d, f, and h) GO analyses of DEGs from HR-1 vs. HR-0, HR-3 vs. HR-0, HR-5 vs. HR-0, and HR-7 vs. HR-0, respectively. Only the top 20 terms are listed here.
