
Figure 5.
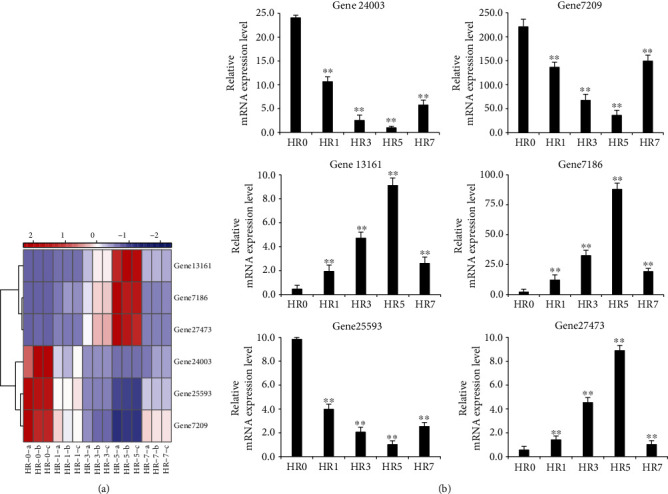
Quantitative reverse-transcription PCR (qRT-PCR) validation of differentially expressed genes (DEGs) identified from RNA-seq. (a) Heatmap was constructed for DEGs on the basis of log2 FPKM values ranging from blue (low expression) to red (high expression) at each time point. FPKM (fragments per kilobase per million mapped reads) was used to calculate expression levels of genes. (b) mRNA expression levels of the DEGs above were validated by qRT-PCR, normalized to the H3 gene. Data represent the mean values ± SD. ∗P < 0.05; ∗∗P < 0.01, calculated using Student's t-test.