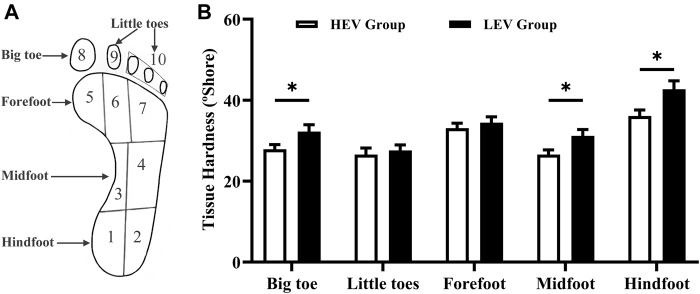
FIGURE 1.
(A) Division of the foot. (B) Results of tissue hardness of plantar tissue in participants (Mean with SEM). The tissue hardness of the little toes was the average of area 8 and area 9; the tissue hardness of the forefoot was the average of area 5, area 6 and area 7; the tissue hardness of the midfoot was the average of area 3 and area 4; the tissue hardness of the hindfoot was the average of area 1 and area 2. HEV: High Exercise Volume (≥27 Mets·h/week); LEV: Low Exercise Volume (<27 Mets·h/week); SEM: standard error of mean. * indicates a significant difference between the HEV group (n = 45) and LEV group (n = 35) (p < 0.05).

