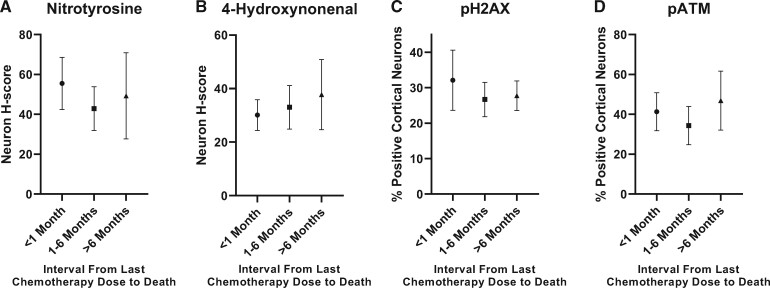
FIGURE 5.
Quantification of oxidative stress and DNA damage in cortical neurons by time interval between last chemotherapy dose and patient death: (A) nitrotyrosine, (B) 4-hydroxynonenal, (C) pH2AX and (D) pATM staining did not differ significantly by time interval (p > 0.05 for all comparisons; n = 5 for <1-month-interval subgroup, n = 6 for 1–6-month-interval subgroup, n = 4 for >6-month-interval subgroup). Error bars represent the standard error of the mean. pATM, phospho-ataxia telangiectasia mutated kinase; pH2AX, phospho-H2AX.

