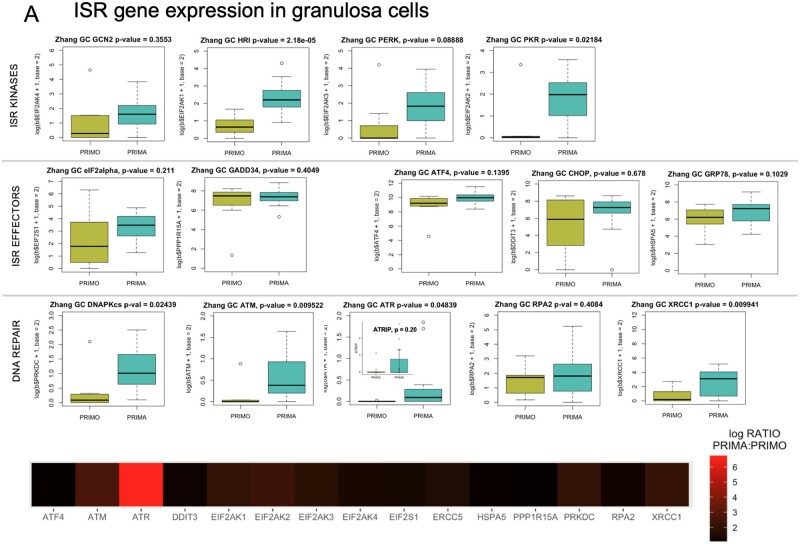
Figure 3.
Gene expression and uORF analysis of control cell and GC gene sets. Zhang et al. (2018) gene expression data were explored and comparative expression of ISR machinery and DNA repair genes between PF and primary follicle GCs was determined (A). Heme-regulated inhibitor (HRI/EIF2AK1), protein kinase RNA-activated (PKR/EIF2AK2), protein kinase, DNA-activated, catalytic subunit (DNAPk-cs/PRKDC), ataxia telangiectasia mutated (ATM), ataxia telangiectasia and rad3 related (ATR), and X-ray repair cross complementing 1 (XRCC1) were all significantly higher in primary GCs. Data in panel A graphs are summarized as a heatmap immediately below, with the log (Base 2) ratio of expression in primary GCs to PF GCs depicted. (B) shows a heatmap generated as in (A) of the Powley UVB-responsive gene set, and Panel (C) is a heatmap of the same expression ratio for the Zhang selected GC gene set. (D) is a comparison of Gerstein uORFs quality scores between the selected gene sets and randomly selected genes. Histograms of uORF score frequencies were prepared for a set of randomly selected genes (top left) and each of the previously evaluated gene sets (Powley, Zhang selected, Zhang criteria, and Day ANM: age of natural menopause). Density plots reveal that in each case, a rightward ‘shift’ in uORF scores is present (blue) compared to randomly selected genes (red). In the cases of Powley UVB, Zhang selected GC, and Day ANM gene sets, a high score ‘bump’ where uORF scores within a particular range are over-represented is detectable compared to randomly selected genes. These shifts correspond directly to increased mean HiQ uORF scores for each gene set (Table II). P values shown comparing uORF densities were calculated using the Kolmogorov–Smirnov test.

