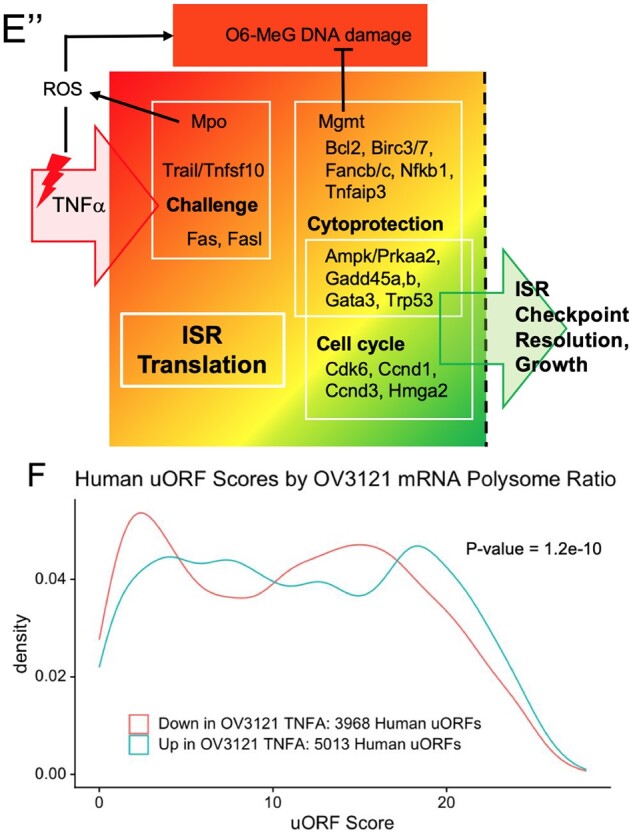
Figure 4.

Continued by direct cell counts (A) and with a fluorescent assay (Supplementary Fig. S4A). In each case, 10 ng/ml Tnf stimulated cell growth 24 H post-treatment, 20 ng/ml resulted in no net change in cell number (Panel A, Supplementary Fig. S4A), and 50 ng/ml resulted in a significant reduction in cell number (A). Panel (B) shows that 10 ng/ml Tnf significantly increases Ser51 P-eIF2 at 4 and 8 h (H) compared to cells collected 4H post-VEH (asterisk * indicates that two replicates were performed for 16H time point instead of three as in other cases). Panels (C) and (D) show normalized ribosomal fractionation traces and corresponding Polysome: Monosome ratios for two OV3121 cell replicates treated with VEH or 10 ng/ml Tnf for 3 or 12 H. Areas under the curve for POLY(some) and 80S regions indicated in C were used to calculate ratios in D. Plots in (E) are representative examples of Nanostring quantification of mRNAs in SUB (polysomal) versus POLY fractions in (C). POLY: SUB deltas were determined by calculating the ratio between the POLY:SUB ratio for 3 h Tnf treatment and VEH-treated cells. Sub-panels in Fig. 4E denote functional gene groups, and sub-panel 4E”’ is a data summary where mRNAs are organized by function and threshold ISR activity is indicated by the dashed vertical line. Panel (F) shows a summary density plot of Gerstein uORF quality scores for human mRNAs whose mouse orthologues are enriched (UP) in OV3121 polysome fractions 3H post-Tnf compared to those that are diminished (DOWN) in polysomes. P values for A, B, D and E were determined using Welch’s t test, for F, the Kolmogorov–Smirnov test.
