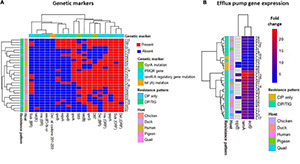
FIGURE 1.

Heatmap supported by hierarchical clustering (dendrogram) depicting the overall distribution of genetic markers (A) and efflux pumps gene expression (B) in the 29 XDR Salmonella isolates. The isolates are color-annotated based on their hosts (C, chicken; D, duck; H, human; P, pigeon, and Q, quails) and resistance pattern [i.e., to CIP, ciprofloxacin (n = 4) and to both CIP and TIG (n = 25)]. The genetic markers are color-annotated based on their type. BR, binding region; ORF, open reading frame.
