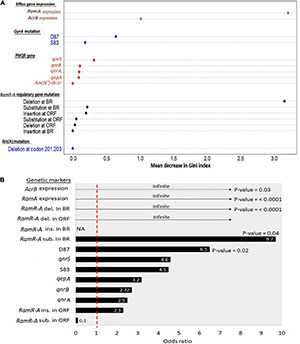
FIGURE 2.

Ranked significance of genetic markers in the XDR Salmonella isolates that showed co-resistance to ciprofloxacin and tigecycline (n = 25). (A) Random forest classification analyses showing the importance of genetic markers in differentiating the co-resistant XDR Salmonella isolates from those that were resistant to CIP only (n = 4). The X-axis shows the mean decrease in Gini index for each marker. The higher the mean decrease in the Gini index, the more important the marker. (B) Significance of association of genetic markers and the co-resistance phenotype. The X-axis shows the odds ratio (at confidence intervals = 95%) of the respective genetic features that are shown on the Y-axis. Numbers within the bars refer to odds value. Numbers beneath the bars show the significance of association (p-value based on Fisher’s exact test at a cutoff level of 0.05) between the occurrence of certain genetic features and the appearance of the co-resistance to CIP and TIG in the 25 XDR isolates. The odds ratios that were shown as headed arrow indicate an infinite (∞) or maximum odds. The odds ratio of 1 (the vertical dashed red line) indicates no contribution of the respective genetic feature to the occurrence of the co-resistant phenotype. Del, deletion; Sub, substitution; Ins, insertion; BR, binding region; ORF, open reading frame.
