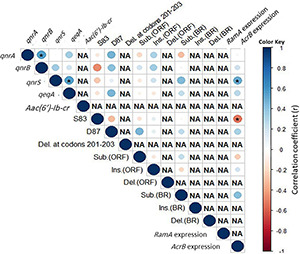
FIGURE 3.

Correlation among genetic features in the co-resistant XDR Salmonella isolates (n = 25). Asterisks (*) indicate a significant correlation at a 0.05 p-value. The color scale refers to the correlation coefficient (blue and red colors indicate negative and positive correlations, respectively).
