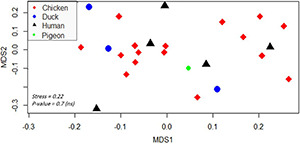
FIGURE 4.

Non-metric multidimensional scaling showing the clustering and overlap of various isolates belonging to different hosts. Different hosts are color- and shape-coded. Stress refers to the performance of the multidimensional scaling. The p-value was calculated by PERMANOVA test and refers to the significant clustering of the groups. A p-value < 0.05 indicates that isolates were not significantly clustered based on their hosts (thus there is an overlap among hosts). The abbreviations of codes are described in Table 2 in detail.
