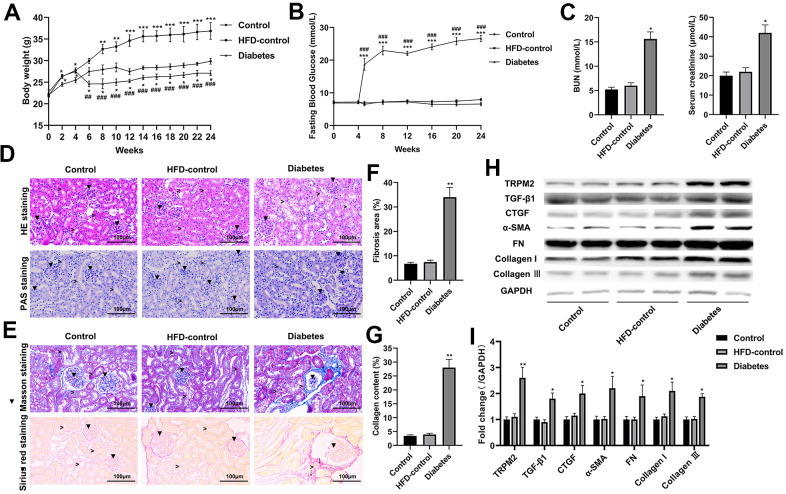
Figure 1.
Renal injury and TRPM2 expression were increased in the kidneys of mice with HFD/STZ-induced diabetes. (A) Body weight of mice was documented from week 0 to 24 of the HFD/STZ-induced diabetes model. (B) Blood glucose was measured in the indicated weeks. (C) The levels of blood creatinine and BUN were tested before the mice were sacrificed. (D) HE and PAS staining of mouse kidney specimens in the 24th week (▼indicates renal glomeruli, ˃ indicated renal tubules). (E–G) Fibrosis was determined by Masson and Sirius red staining (▼indicates renal glomeruli, ˃ indicates renal tubules, ↓ indicates renal interstitials). (H, I) Protein analysis was conducted to evaluate the protein expression levels of TRPM2, TGF-β1, CTGF, α-SMA, FN, Collagen I and Collagen III in renal tissues of mice in the 24th week. The data are shown as the mean ± SD, n = 6 per group; *p < 0.05, **p < 0.01 and ***p < 0.001 versus the control group; #p < 0.05, ##p < 0.01 and ###p < 0.001 versus the HFD-control group.

