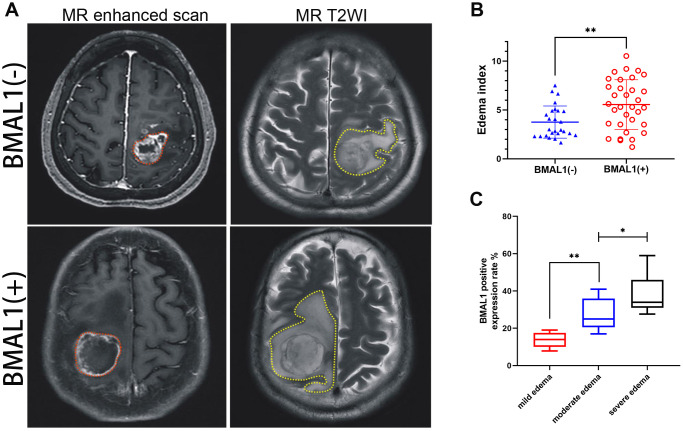
Figure 3.
MR images of clinical patients showed the relationship between peritumoral brain edema and BMAL1 expression. (A) A set of representative graphs displaying MR images of brain edema. The red dotted line is the solid part of the tumor, and the yellow dotted line is the area of brain edema around the tumor. Patients with BMAL1 (+) had obvious peritumoral edema. (B) The EI was compared between the BAML1 (+) expression group (n = 59) and the BAML1 (−) expression group (n = 20). (C) BMAL1 expression levels in the mild edema group (n = 5), moderate edema group (n = 15), and severe edema group (n = 39) were assessed. *p < 0.05, **p < 0.01. ***p < 0.001.

