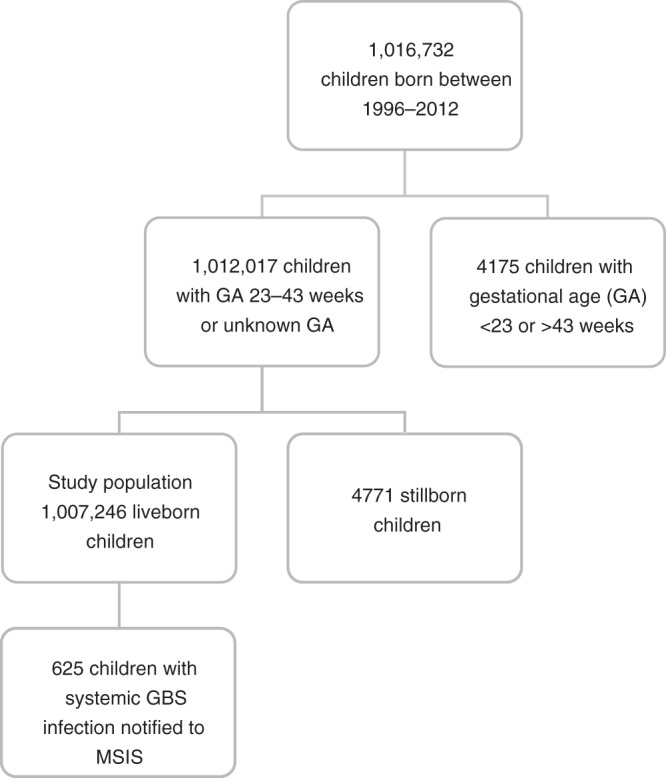
Fig. 1. Flow chart of the study population.

The flow chart shows the total number of children born in Norway between 1996 and 2012 (abstracted from the Medical Birth registry of Norway) and among these the study population after exclusion of children born before gestational age (GA) 23 weeks or later than GA week 43, and stillbirths. The number of children with invasive group B streptococcus (GBS) infection during the first year of life is also shown (abstracted from the Norwegian Surveillance System for Communicable Diseases).
