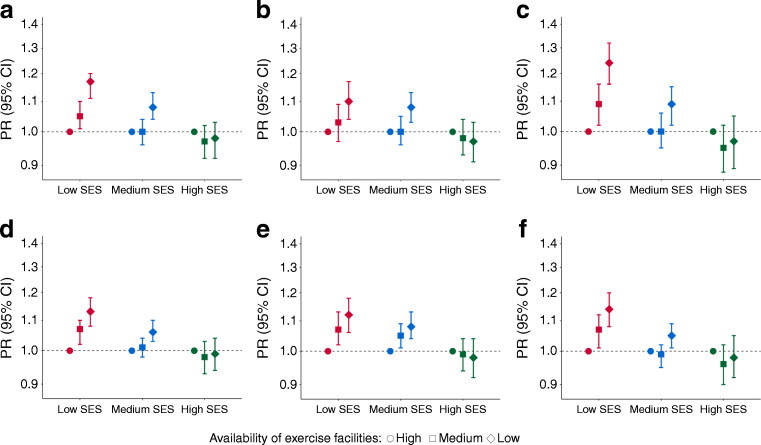
Fig. 2.
Association of exercise facility availability with (a–c) type 2 diabetes and (d–f) obesity, adjusted by age and population density. Interactions by area-level SES are presented. Overall data are shown (a, d), as well as data stratified by sex: men (b, e); women (c, f). Dashed lines at PR 1.0 represent the reference group (highest availability of exercise facilities). There was a statistically significant effect modification of area-level SES on the relationship between exercise facility availability and obesity and type 2 diabetes (p value for interaction <0.001)

