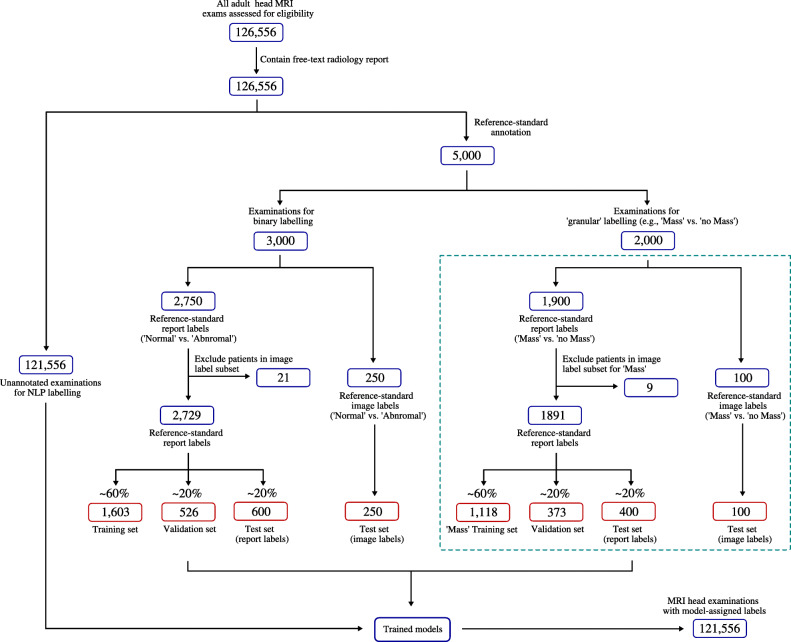
Fig. 1.
Flowchart showing datasets used to train, validate, and test our models. For each model, a subset of reports was assigned ‘reference-standard image labels’ (n = 250 for normal/abnormal, n = 100 for each of the 7 specialised categories) which served as a fixed hold-out ‘image label’ test set. After removing reports describing separate studies of patients in the test set, the remaining reports with ‘reference-standard report labels’ (e.g. n = 2729 for normal/abnormal, 1891 for ‘mass’/’no mass’ etc.) were split at the patient level into training and validation datasets, as well as a ‘report label’ test dataset, and model testing was performed in two ways: using the test set with (i) reference-standard report labels and (ii) reference-standard image labels. This splitting procedure was repeated 10 times for each category to generate model confidence intervals (the test set with reference-standard image labels always remained fixed). Note that the splitting procedure in the dashed teal box was performed separately for each of the 7 specialised categories of abnormality; however, only a single category (‘mass’) has been included for brevity. The full flow chart for all granular categories is available in the supplemental material (Fig. S1)

