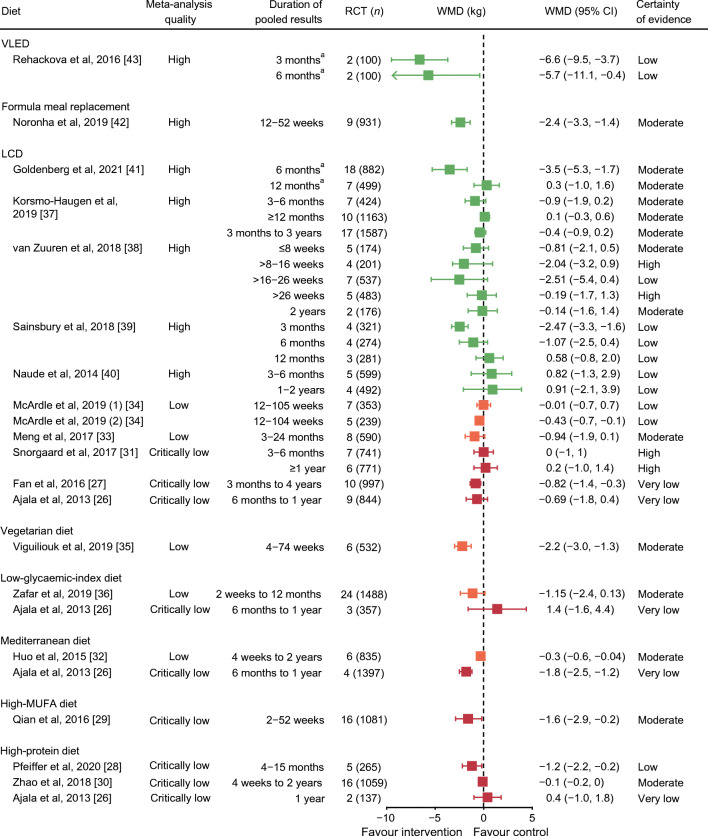
Fig. 2.
All published meta-analyses of intervention diets vs control diets on weight loss (kg) stratified by overall quality in each diet type using AMSTAR 2 quality (green, high quality; orange, low quality; red, critically low quality). WMDs are presented alongside 95% CIs (error bars). Pooled results of McArdle et al., 2019 [34], Fan et al., 2016 [27], Zafar et al., 2019 [36] and Zhao et al., 2018 [30] are standardised mean differences. aComplete case data. GRADE level for certainty of evidence is rated as follows: ‘high’ indicates that we are very confident that the true effect lies close to that of the estimate of the effect; ‘moderate’ indicates that we are moderately confident in the effect estimate (the true effect is likely to be close to the estimate of the effect, but there is a possibility that it is substantially different); ‘low’ indicates that our confidence in the effect estimate is limited (the true effect may be substantially different from the estimate of the effect); and ‘very low’ indicates that we have very little confidence in the effect estimate (the true effect is likely to be substantially different from the estimate of effect)

